
Industry Statistics and Trends
Market size and recent performance (2015-2030)
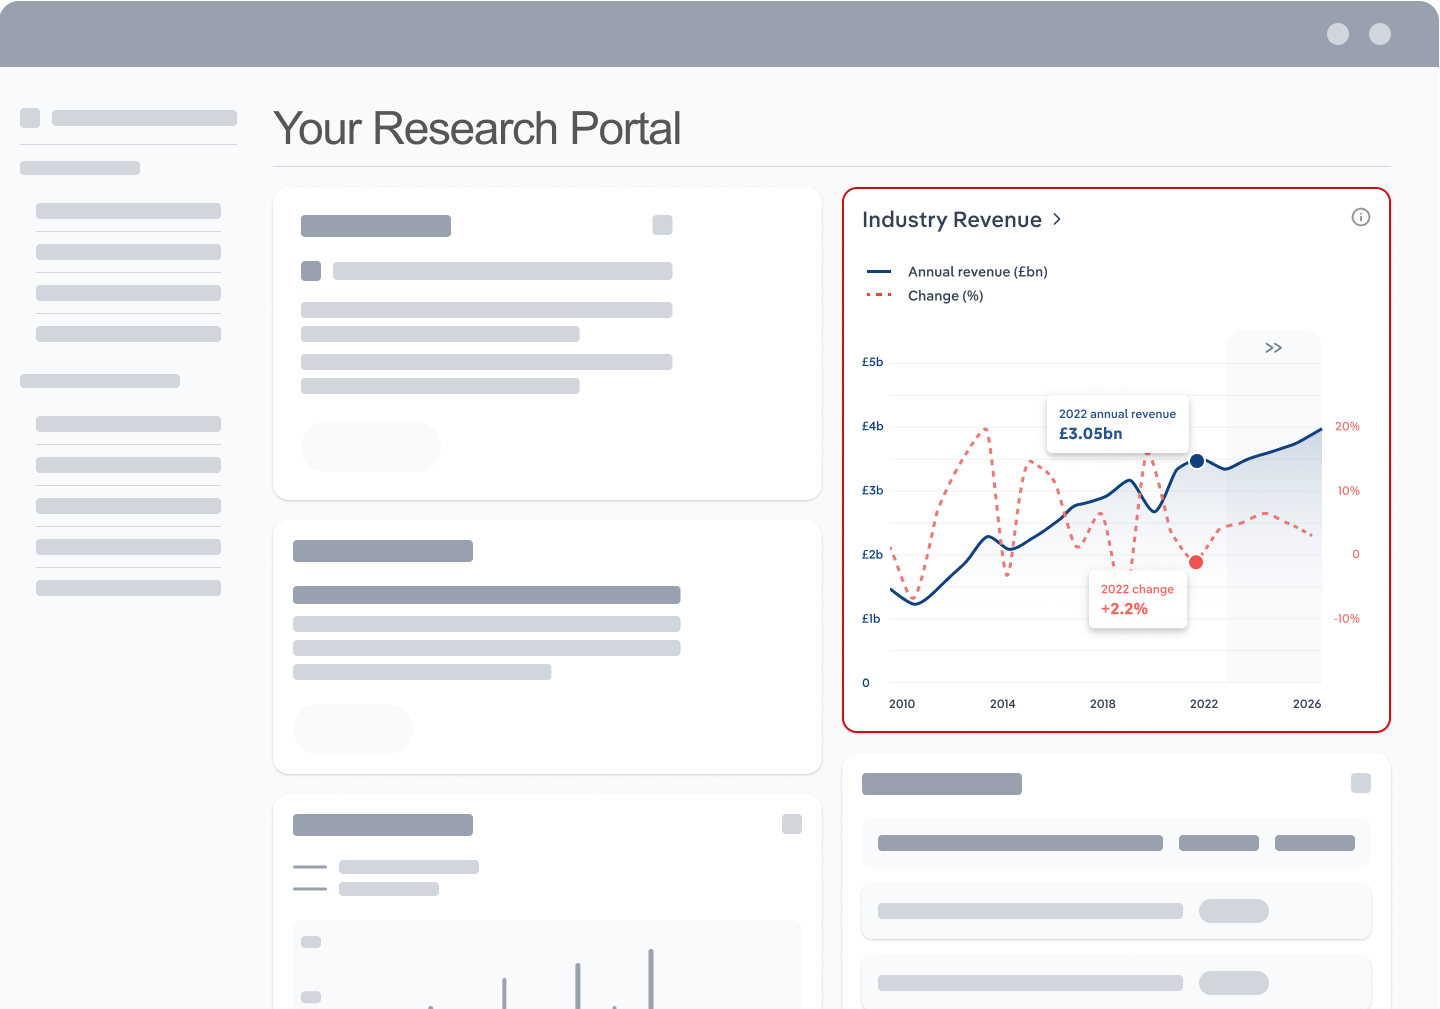
Industry revenue has declined at a CAGR of 1.9 % over the past five years, to reach an estimated $23.8bn in 2025.
Trends and Insights
Fluctuations in manufacturing and mining impact performance significantly
- The manufacturing and mining sectors are the largest downstream market for fluid power equipment distributors, comprising a third of total industry revenue. Following the pandemic, these sectors initially rebounded with strength, driving demand for fluid power equipment. A surge in oil prices prompted increased mining activity, necessitating more equipment for drilling and refining efforts.
- Additional trends and insights available with purchase
Industry outlook (2026-2031)
Market size is projected to grow over the next five years.
Trends and Insights
The construction sector will drive growth
- Residential and nonresidential construction growth will be a growth driver for fluid power equipment distributors over the next two years. Residential construction will climb by 2.1% in 2025 and further accelerate by 5.1% in 2026, while private nonresidential construction will expand by 2.6% and 4.1% over the same period. These developments will strengthen the demand for fluid power solutions essential for operating heavy machinery like tractors and cranes.
Biggest companies in the Fluid Power Equipment Distributors in the US
| Company | Market Share (%)
2025 | Revenue ($m)
2025 | Profit ($m)
2025 | Profit Margin (%)
2025 |
|---|---|---|---|---|
W.W. Grainger, Inc. | 11,871.9 | 1,744.6 | 14.7 | |
Applied Industrial Technologies Inc. | 1,631.9 | 186.4 | 11.4 |
To view the market share and analysis for all 2 top companies in this industry, view purchase options.
Products & Services Segmentation
Industry revenue is measured across several distinct product and services lines, including Fluid power pumps, motors and parts, Fluid power valves and Fluid power connectors and assemblies. Fluid power pumps, motors and parts is the largest segment of the Fluid Power Equipment Distributors in the US.
Trends and Insights
Fluid power pumps, motors and parts are the primary components
- Fluid power pumps, motors and parts form almost half of industry revenue, with rising demand driven by increased industrial automation and the need for system repairs.
- More insights available in the full report
Table of Contents
About this industry
Industry definition
Operators distribute fluid power equipment to manufacturers, mining companies and other users. The distributed equipment can be hydraulic or pneumatic, using liquid or gas to generate power and actuate machines and devices. Operators distribute fluid power pumps and motors, as well as parts and accessories such as valves.
What's included in this industry?
Products and services covered in the Fluid Power Equipment Distributors industry in the United States include Distributing fluid power pumps and motors and Distributing fluid power parts and accessories.Companies
Companies covered in the Fluid Power Equipment Distributors industry in the United States include W.W. Grainger, Inc. and Applied Industrial Technologies Inc.Purchase this report to view all 2 major companies in this industry.
Related Terms
Related terms covered in the Fluid Power Equipment Distributors industry in the United States include fluid power, hydraulic and pneumatic.Industry Code
NAICS 423830 - Fluid Power Equipment Distributors in the US
Performance
Get an indication of the industry's health through historical, current and forward-looking trends in the performance indicators that make or break businesses.
Analyst insights
Fluctuations in manufacturing and mining have significantly impacted distributors' revenues. As these sectors slowed down because of declining oil prices and rising interest ...
In this chapter (4)
- Current Performance
- Outlook
- Volatility
- Life Cycle
Key metrics
- Annual Revenue, Recent Growth, Forecast, Revenue Volatility
- Number of Employees, Recent Growth, Forecast, Employees per Business, Revenue per Employee
- Number of Businesses, Recent Growth, Forecast, Employees per Business, Revenue per Business
- Total Profit, Profit Margin, Profit per Business
Charts
- Revenue, including historical (2015-2024) and forecast (2025-2030)
- Employees, including historical (2015-2024) and forecast (2025-2030)
- Businesses, including historical (2015-2024) and forecast (2025-2030)
- Profit, including historical (2015-2025)
- Industry Volatility vs. Revenue Growth
- Industry Life Cycle
Detailed analysis
- Trends in supply, demand and current events that are driving current industry performance
- Expected trends, economic factors and ongoing events that drive the industry's outlook
- Key success factors for businesses to overcome volatility
- How contribution to GDP, industry saturation, innovation, consolidation, and technology and systems influence the industry's life cycle phase.
Products and Markets
Learn about an industry's products and services, markets and trends in international trade.
Analyst insight
The 54.0% tariff on Chinese goods, including hydraulic and pneumatic components, will significantly increase procurement costs for distributors. These higher expenses will st...
In this chapter
- Products & Services
- Major Markets
Key metrics
- Largest market segment and value in 2025
- Product innovation level
Charts
- Products & services segmentation in 2025
- Major market segmentation in 2025
Detailed analysis
- Trends impacting the recent performance of the industry's various segments
- Innovations in the industry's product or service offering, specialization or delivery method
- Key factors that successful businesses consider in their offerings
- Buying segments and key trends influencing demand for industry products and services
Geographic Breakdown
Discover where business activity is most concentrated in an industry and the factors driving these trends to find opportunities and conduct regional benchmarking.
Analyst insights
The Southwestern region of the United States, specifically Texas, serves as a significant energy hub. Fluid power equipment plays a crucial role in performing diverse tasks a...
In this chapter (1)
- Business Locations
Charts
- Share of revenue, establishment, wages and employment in each state
- Share of population compared to establishments in each region in 2025
Tables
- Number and share of establishments in each state in 2025
- Number and share of revenue each state accounts for in 2025
- Number and share of wages each state accounts for in 2025
- Number and share of employees in each state in 2025
Detailed analysis
- Geographic spread of the industry across North America, and trends associated with changes in the business landscape
- Key success factors for businesses to use location to their advantage
Competitive Forces
Get data and insights on what's driving competition in an industry and the challenges industry operators and new entrants may face, with analysis built around Porter's Five Forces framework.
Analyst insights
Wholesalers face external competition from direct-to-manufacturer sales. Even so, wholesalers pride themselves on customer service and quick turnaround times to attract clien...
In this chapter (4)
- Concentration
- Barriers to Entry
- Substitutes
- Buyer & Supplier Analysis
Key metrics
- Industry concentration level
- Industry competition level and trend
- Barriers to entry level and trend
- Substitutes level and trend
- Buyer power level and trend
- Supplier power level and trend
Charts
- Market share concentration among the top 4 suppliers from 2020-2025
- Supply chain including upstream supplying industries and downstream buying industries, flow chart
Detailed analysis
- Factors impacting the industry’s level of concentration, such as business distribution, new entrants, or merger and acquisition activity.
- Key success factors for businesses to manage the competitive environment of the industry.
- Challenges that potential industry entrants face such as legal, start-up costs, differentiation, labor/capital intensity and capital expenses.
- Key success factors for potential entrants to overcome barriers to entry.
- Competitive threats from potential substitutes for the industry’s own products and services.
- Key success factors for how successful businesses can compete with substitutes.
- Advantages that buyers have to keep favorable purchasing conditions.
- Advantages that suppliers have to maintain favorable selling conditions.
- Key success factors for how businesses can navigate buyer and supplier power.
Companies
Learn about the performance of the top companies in the industry.
Analyst insights
No company holds a market share of more than 5.0%. Fluid power distribution is highly fragmented, with lower barriers of entry.
In this chapter
- Market Share Concentration
- Companies
- Company Spotlights
Charts
- Industry market share by company in 2021 through 2025
- Major companies in the industry, including market share, revenue, profit and profit margin in 2025
- Overview of W.W. Grainger, Inc.'s performance by revenue, market share and profit margin from 2019 through 2025
- Overview of Applied Industrial Technologies Inc.'s performance by revenue, market share and profit margin from 2019 through 2025
Detailed analysis
- Description and key data for W.W. Grainger, Inc., and factors influencing its performance in the industry
- Description and key data for Applied Industrial Technologies Inc., and factors influencing its performance in the industry
External Environment
Understand the demographic, economic and regulatory factors that shape how businesses in an industry perform.
Analyst insights
Licensing requirements vary based on the distributor's target market. Distributors selling exclusively to other businesses only need a wholesaler's license, whereas those eng...
In this chapter
- External Drivers
- Regulation & Policy
- Assistance
Key metrics
- Regulation & policy level and trend
- Assistance level and trend
Charts
- Regulation & Policy historical data and forecast (2015-2030)
- Assistance historical data and forecast (2015-2030)
Detailed analysis
- Demographic and macroeconomic factors influencing the industry, including Regulation & Policy and Assistance
- Major types of regulations, regulatory bodies, industry standards or specific regulations impacting requirements for industry operators
- Key governmental and non-governmental groups or policies that may provide some relief for industry operators.
Financial Benchmarks
View average costs for industry operators and compare financial data against an industry's financial benchmarks over time.
Analyst insights
While profit is lower for wholesalers because of the nature of their operations, it has remained consistent throughout the years. An uptick in commodity prices near the end o...
In this chapter
- Cost Structure
- Financial Ratios
- Key Ratios
Key metrics
- Profit margin, and how it compares to the sector-wide margin
- Average wages, and how it compares to the sector-wide average wage
- Largest cost component as a percentage of revenue
- Industry average ratios for days' receivables, industry coverage and debt-to-net-worth ratio
Charts
- Average industry operating costs as a share of revenue, including purchases, wages, depreciation, utilities, rent, other costs and profit in 2025
- Average sector operating costs as a share of revenue, including purchases, wages, depreciation, utilities, rent, other costs and profit in 2025
- Investment vs. share of economy
Data tables
- Industry Multiples (2018-2023)
- Industry Tax Structure (2018-2023)
- Income Statement (2018-2023)
- Balance Sheet (2018-2023)
- Liquidity Ratios (2018-2023)
- Coverage Ratios (2018-2023)
- Leverage Ratios (2018-2023)
- Operating Ratios (2018-2023)
- Cash Flow & Debt Service Ratios (2015-2030)
- Revenue per Employee (2015-2030)
- Revenue per Enterprise (2015-2030)
- Employees per Establishment (2015-2030)
- Employees per Enterprise (2015-2030)
- Average Wage (2015-2030)
- Wages/Revenue (2015-2030)
- Establishments per Enterprise (2015-2030)
- IVA/Revenue (2015-2030)
- Imports/Demand (2015-2030)
- Exports/Revenue (2015-2030)
Detailed analysis
- Trends in the cost component for industry operators and their impact on industry costs and profitability
Key Statistics
Industry Data
Data Tables
Including values and annual change:
- Revenue (2015-2030)
- IVA (2015-2030)
- Establishments (2015-2030)
- Enterprises (2015-2030)
- Employment (2015-2030)
- Exports (2015-2030)
- Imports (2015-2030)
- Wages (2015-2030)
Top Questions Answered
Unlock comprehensive answers and precise data upon purchase. View purchase options.
What is the market size of the Fluid Power Equipment Distributors industry in the United States in 2026?
The market size of the Fluid Power Equipment Distributors industry in the United States is $23.8bn in 2026.
How many businesses are there in the Fluid Power Equipment Distributors industry in the United States in 2025?
There are 2,392 businesses in the Fluid Power Equipment Distributors industry in the United States, which has declined at a CAGR of 1.5 % between 2020 and 2025.
How may import tariffs affect the Fluid Power Equipment Distributors industry in the United States?
The Fluid Power Equipment Distributors industry in the United States is unlikely to be materially impacted by import tariffs with imports accounting for a low share of industry revenue.
How may export tariffs affect the Fluid Power Equipment Distributors industry in the United States?
The Fluid Power Equipment Distributors industry in the United States is unlikely to be materially impacted by export tariffs with exports accounting for a low share of industry revenue.
Has the Fluid Power Equipment Distributors industry in the United States grown or declined over the past 5 years?
The market size of the Fluid Power Equipment Distributors industry in the United States has been declining at a CAGR of 1.9 % between 2020 and 2025.
What is the forecast growth of the Fluid Power Equipment Distributors industry in the United States over the next 5 years?
Over the next five years, the Fluid Power Equipment Distributors industry in the United States is expected to grow.
What are the biggest companies in the Fluid Power Equipment Distributors industry in the United States?
The biggest companies operating in the Fluid Power Equipment Distributors industry in the United States are W.W. Grainger, Inc. and Applied Industrial Technologies Inc.
What does the Fluid Power Equipment Distributors industry in the United States include?
Distributing fluid power pumps and motors and Distributing fluid power parts and accessories are part of the Fluid Power Equipment Distributors industry in the United States.
Which companies have the highest market share in the Fluid Power Equipment Distributors industry in the United States?
The company holding the most market share in the Fluid Power Equipment Distributors industry in the United States is W.W. Grainger, Inc..
How competitive is the Fluid Power Equipment Distributors industry in the United States?
The level of competition is high and steady in the Fluid Power Equipment Distributors industry in the United States.
Methodology
How are IBISWorld reports created?
IBISWorld has been a leading provider of trusted industry research for over 50 years to the most successful companies worldwide. With offices in Australia, the United States, the United Kingdom, Germany and China, we are proud to have local teams of analysts that conduct research, data analysis and forecasting to produce data-driven industry reports.
Our analysts start with official, verified and publicly available sources of data to build the most accurate picture of each industry. Analysts then leverage their expertise and knowledge of the local markets to synthesize trends into digestible content for IBISWorld readers. Finally, each report is reviewed by one of IBISWorld’s editors, who provide quality assurance to ensure accuracy and readability.
IBISWorld relies on human-verified data and human-written analysis to compile each standard industry report. We do not use generative AI tools to write insights, although members can choose to leverage AI-based tools within the platform to generate additional analysis formats.
What data sources do IBISWorld analysts use?
Each industry report incorporates data and research from government databases, industry-specific sources, industry contacts, and our own proprietary database of statistics and analysis to provide balanced, independent and accurate insights.
Key data sources in the US include:
- US Census Bureau
- US Bureau of Labor Statistics
- US International Trade Commission
Analysts also use industry specific sources to complement catch-all sources, although their perspective may focus on a particular organization or representative body, rather than a clear overview of all industry operations. However, when balanced against other perspectives, industry-specific sources provide insights into industry trends.
These sources include:
- Industry and trade associations
- Industry federations or regulators
- Major industry players annual or quarterly filings
Finally, IBISWorld’s global data scientists maintain a proprietary database of macroeconomic and demand drivers, which our analysts use to help inform industry data and trends. They also maintain a database of statistics and analysis on thousands of industries, which has been built over our more than 50-year history and offers comprehensive insights into long-term trends.
How does IBISWorld forecast its data?
IBISWorld’s analysts and data scientists use the sources above to create forecasts for our proprietary datasets and industry statistics. Depending on the dataset, they may use regression analysis, multivariate analysis, time-series analysis or exponential smoothing techniques to project future data for the industry or driver. Additionally, analysts will leverage their local knowledge of industry operating and regulatory conditions to impart their best judgment on the forecast model.
IBISWorld prides itself on being a trusted, independent source of data, with over 50 years of experience building and maintaining rich datasets and forecasting tools. We are proud to be the keystone source of industry information for thousands of companies across the world.
Learn more about our methodology and data sourcing on the Help Center.


