About the Street Vendors in Missouri Market Research Report
What’s Included in the Street Vendors in Missouri Market Research Report
Definition of the Street Vendors in Missouri?
Street vendors comprise establishments primarily engaged in preparing and serving meals and snacks for immediate consumption from motorized vehicles or nonmotorized carts. An establishment is the main location from which the caterer route is serviced, not each cart or vehicle. Included are establishments primarily engaged in providing food services from vehicles, like hot dog carts and ice cream trucks.
What’s included in the Street Vendors in Missouri?
The Street Vendors in Missouri includes mobile american food stands, carts and vendors, mobile dessert stands, carts and vendors, mobile central and south american food stands, carts and vendors, mobile asian food stands, carts and vendors, mobile mixed ethnicity stands, carts and vendors, mobile greek and mediterranean stands, carts and vendors, mobile seafood stands, carts and vendors and mobile snack and beverage stands, cards and vendors. Related terms covered in the Street Vendors in Missouri industry report includes the traditional street vendor wagon wheel cart with two wheels at one end and stands at the other, facilities that provide hot food to customers' orders that require a driver and a cook, vehicles that sell mainly prepacked, cold foods on a self-serve basis, and is usually operated by a single person and a store that has a physical presence and location, as opposed to an online retailer or a street vendor.
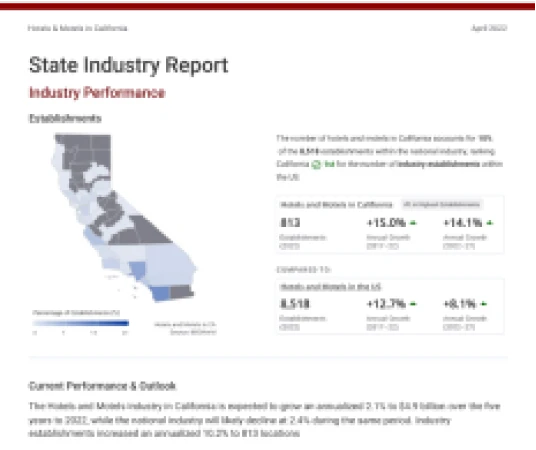
Industry Performance of the Street Vendors industry in Missouri
Benchmark the Street Vendors in Missouri industry performance with all MO county and national performance.
Street Vendors in Missouri
#22 in Highest Revenue 1.4% of state's GDPRevenue (2026)
Annual Growth (2021-26)
Annual Growth (2026-31)
Street Vendors in the US
Revenue (2025)
Annual Growth (2020-25)
Annual Growth (2025-30)
For the full list of industry drivers, see report purchase options.
Key Drivers of the Street Vendors industry in Missouri
See how key industry drivers, such as median houshold income, population, per capita disposable income, consumer spending, urban population and consumer confidence index are impacting Street Vendors in Missouri
Missouri Economic Indicators
Median Houshold Income
Population
Per Capita Disposable Income
View more economic information in MO State Economic profile
US Key External Drivers
Consumer spending
Urban population
Consumer confidence index
For the full list of industry drivers, see report purchase options.
County Data of the Street Vendors industry in Missouri
Access proprietary data on county in the Street Vendors in Missouri, such as St. Louis County, Jackson County and Greene County. Data includes figures on revenue, establishments, employees and wages by counties.
Key Statistics of the Street Vendors industry in Missouri
Download 19 years of historical data and 5 years of projected performance.