About the Youth Residential & Rehabilitation Services in Massachusetts Market Research Report
What’s Included in the Youth Residential & Rehabilitation Services in Massachusetts Market Research Report
Definition of the Youth Residential & Rehabilitation Services in Massachusetts?
This industry includes group foster homes, group homes, halfway homes, orphanages and boot camps. While the industry provides some services to adults, these facilities are primarily for children and youth.
What’s included in the Youth Residential & Rehabilitation Services in Massachusetts?
The Youth Residential & Rehabilitation Services in Massachusetts includes residential facilities with other services, residential facilities with counseling, residential facilities without counseling or rehabilitation, other services including for older adults and individuals with disabilities and contributions (private and from the government). Related terms covered in the Youth Residential & Rehabilitation Services in Massachusetts industry report includes a private residence designed to serve as a nonsecure home for unrelated persons who share a common characteristic, medicaid waiver programs that assist people who have physical or mental disabilities, the process of replacing long-stay mental institutions with less-isolated community mental health services, such as group homes, these programs have met the strict federal funding requirements for nonfamily settings, ccwis systems improve data sharing and support prevention and case management by leveraging flexible technology that meets federal title iv-e standards, the social security act (section 1905(i)) defines an imd as a hospital, nursing facility, or other institution of more than 16 beds, primarily engaged in providing diagnosis, treatment, or care of persons with mental diseases and arpa hcbs funds refers to the enhanced federal medicaid funding authorized under section 9817 of the us rescue plan act (arpa) of 2021. congress provided a temporary 10-percentage-point increase in the federal matching rate for medicaid home and community-based services (hcbs) — the programs that fund non-institutional, community-based care for individuals with disabilities, mental health needs, idd and elderly populations.
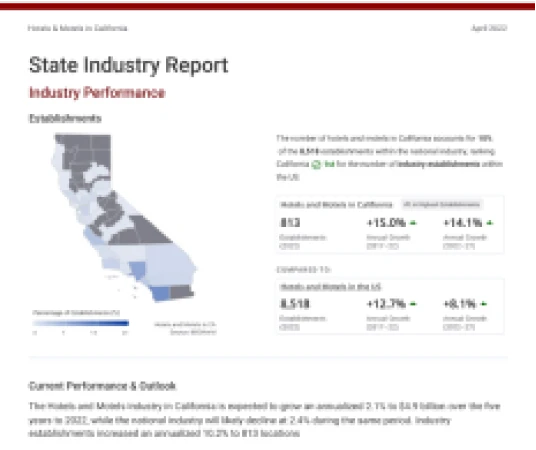
Industry Performance of the Youth Residential & Rehabilitation Services industry in Massachusetts
Benchmark the Youth Residential & Rehabilitation Services in Massachusetts industry performance with all MA county and national performance.
Youth Residential & Rehabilitation Services in Massachusetts
#8 in Highest Revenue 3.3% of state's GDPRevenue (2026)
Annual Growth (2021-26)
Annual Growth (2026-31)
Youth Residential & Rehabilitation Services in the US
Revenue (2025)
Annual Growth (2020-25)
Annual Growth (2025-30)
For the full list of industry drivers, see report purchase options.
Key Drivers of the Youth Residential & Rehabilitation Services industry in Massachusetts
See how key industry drivers, such as population, net migration, per capita disposable income, federal funding for social services, per capita disposable income and federal funding for medicare and medicaid are impacting Youth Residential & Rehabilitation Services in Massachusetts
Massachusetts Economic Indicators
Population
Net Migration
Per Capita Disposable Income
View more economic information in MA State Economic profile
US Key External Drivers
Federal funding for social services
Per capita disposable income
Federal funding for Medicare and Medicaid
For the full list of industry drivers, see report purchase options.
County Data of the Youth Residential & Rehabilitation Services industry in Massachusetts
Access proprietary data on county in the Youth Residential & Rehabilitation Services in Massachusetts, such as Norfolk County, Middlesex County and Worcester County. Data includes figures on revenue, establishments, employees and wages by counties.
Key Statistics of the Youth Residential & Rehabilitation Services industry in Massachusetts
Download 19 years of historical data and 5 years of projected performance.