
Industry Statistics and Trends
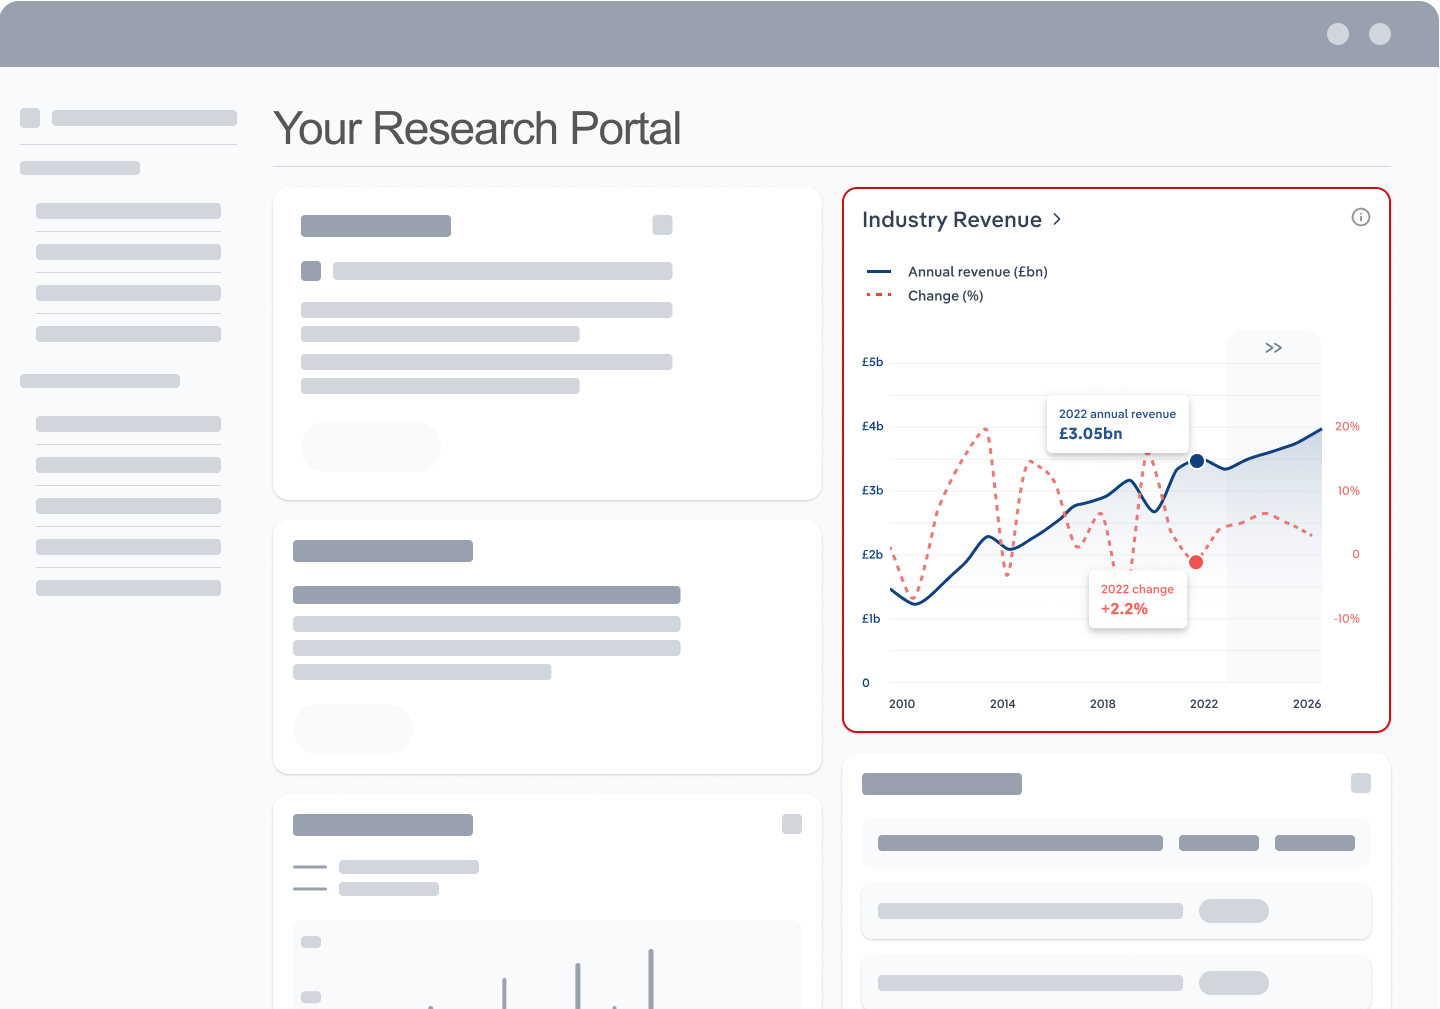
Market size and recent performance (2015-2030)
Industry revenue has grown at a CAGR of 1.6 % over the past five years, to reach an estimated $23.5bn in 2025.
Trends and Insights
The United States has shifted toward 6.88mm ammo, reshaping production trends
- The Next Generation Squad Weapons (NGSW) Program represents a major facet of broader military modernization in the United States, supplementing and replacing outdated equipment for soldiers, working in cohesion with tank, aircraft and ship modernization across different military branches. Announced in 2017 and backed by more than two years of intensive prototyping and testing, NGSW aims to replace the widely used 5.56mm M4 carbine and M249 Squad Automatic Weapon with new platforms that fire a more powerful 6.8mm cartridge.
- Additional trends and insights available with purchase
Industry outlook (2026-2031)
Market size is projected to grow over the next five years.
Trends and Insights
Higher NATO spending requirements will likely support elevated armament procurement
- The 2025 NATO Summit in The Hague will increase required defense spending dramatically over the next decade. Specifically, NATO members must spend 3.5% of GDP on core defense, including troops, equipment and weaponry; these expenses fall under the old 2.0% guideline. The new requirement dictates an additional 1.5% for broader defense and security-related investments, including infrastructure, cybersecurity and broader energy pipeline and generation protection.
Biggest companies in the Guns & Ammunition Manufacturing in the US
| Company | Market Share (%)
2025 | Revenue ($m)
2025 | Profit ($m)
2025 | Profit Margin (%)
2025 |
|---|---|---|---|---|
Olin Corporation | 1,725.3 | 198.4 | 11.5 | |
General Dynamics Corporation | 1,521.4 | 158.5 | 10.4 | |
The Kinetic Group | 1,444.0 | 371.9 | 25.8 |
To view the market share and analysis for all 5 top companies in this industry, view purchase options.
Products & Services Segmentation
Industry revenue is measured across several distinct product and services lines, including Small arms ammunition, Other ammunition and Small arms and machine guns. Small arms ammunition is the largest segment of the Guns & Ammunition Manufacturing in the US.
Trends and Insights
Law enforcement needs and military modernization dynamics fuel demand for small arms and machine guns
- Small arms and machine guns include handguns, rifles, shotguns and automatic weapons designed for individual use or squad-level support. This category covers a wide range of firearms used by civilians, law enforcement agencies and military forces. Civilians primarily own handguns, according to the ATF, while the military uses a wide range of larger-caliber weapons.
- More insights available in the full report
Table of Contents
About this industry
Industry definition
This industry manufactures small weapons (including shotguns, rifles, revolvers, pistols, machine guns and grenade launchers), ammunition, artillery and accessories.
What's included in this industry?
Products and services covered in the Guns & Ammunition Manufacturing industry in the United States include Machine guns manufacturing, Shotguns and rifles manufacturing, Handgun manufacturing, Gun magazines manufacturing, Small arms ammunition manufacturing, Ammunition (except small arms) manufacturing, Grenade manufacturing, Mines manufacturing, Artillery and tank ammunition manufacturing and Howitzers and man-portable and vehicle installed rockets and rocket launchers manufacturing.Companies
Companies covered in the Guns & Ammunition Manufacturing industry in the United States include Olin Corporation, General Dynamics Corporation and The Kinetic Group.Purchase this report to view all 5 major companies in this industry.
Related Terms
Related terms covered in the Guns & Ammunition Manufacturing industry in the United States include ordnance, tampion and ammunition.Industry Code
NAICS 332992 - Guns & Ammunition Manufacturing in the US
Performance
Get an indication of the industry's health through historical, current and forward-looking trends in the performance indicators that make or break businesses.
Analyst insights
The US Army's shift toward 6.8mm rounds creates a major structural shift for the industry. Companies may need to balance production of this new ammo type with the NATO standa...
In this chapter (4)
- Current Performance
- Outlook
- Volatility
- Life Cycle
Key metrics
- Annual Revenue, Recent Growth, Forecast, Revenue Volatility
- Number of Employees, Recent Growth, Forecast, Employees per Business, Revenue per Employee
- Number of Businesses, Recent Growth, Forecast, Employees per Business, Revenue per Business
- Total Profit, Profit Margin, Profit per Business
Charts
- Revenue, including historical (2015-2024) and forecast (2025-2030)
- Employees, including historical (2015-2024) and forecast (2025-2030)
- Businesses, including historical (2015-2024) and forecast (2025-2030)
- Profit, including historical (2015-2025)
- Industry Volatility vs. Revenue Growth
- Industry Life Cycle
Detailed analysis
- Trends in supply, demand and current events that are driving current industry performance
- Expected trends, economic factors and ongoing events that drive the industry's outlook
- Key success factors for businesses to overcome volatility
- How contribution to GDP, industry saturation, innovation, consolidation, and technology and systems influence the industry's life cycle phase.
Products and Markets
Learn about an industry's products and services, markets and trends in international trade.
Analyst insight
Tariffs on metals like brass, copper and steel, essential for ammunition manufacturing, will significantly increase per-unit costs. These higher expenses will pressure manufa...
In this chapter
- Products & Services
- Major Markets
- International Trade
Key metrics
- Largest market segment and value in 2025
- Product innovation level
- Total imports, level and trend
- Total exports, level and trend
- Trade Balance
Charts
- Products & services segmentation in 2025
- Major market segmentation in 2025
- International trade, including imports by country and exports by country
Detailed analysis
- Trends impacting the recent performance of the industry's various segments
- Innovations in the industry's product or service offering, specialization or delivery method
- Key factors that successful businesses consider in their offerings
- Buying segments and key trends influencing demand for industry products and services
- Recent trends in import and export volumes, country of origin or destination, and expected future trends
Geographic Breakdown
Discover where business activity is most concentrated in an industry and the factors driving these trends to find opportunities and conduct regional benchmarking.
Analyst insights
Defense contractors often operate near major military installations and testing sites. This practice helps companies form and maintain relationships with government buyers an...
In this chapter (1)
- Business Locations
Charts
- Share of revenue, establishment, wages and employment in each state
- Share of population compared to establishments in each region in 2025
Tables
- Number and share of establishments in each state in 2025
- Number and share of revenue each state accounts for in 2025
- Number and share of wages each state accounts for in 2025
- Number and share of employees in each state in 2025
Detailed analysis
- Geographic spread of the industry across North America, and trends associated with changes in the business landscape
- Key success factors for businesses to use location to their advantage
Competitive Forces
Get data and insights on what's driving competition in an industry and the challenges industry operators and new entrants may face, with analysis built around Porter's Five Forces framework.
Analyst insights
Companies must engage in competitive bidding processes to compete in defense markets. Robust innovation, strong cost controls, proven reputations and existing relationships d...
In this chapter (4)
- Concentration
- Barriers to Entry
- Substitutes
- Buyer & Supplier Analysis
Key metrics
- Industry concentration level
- Industry competition level and trend
- Barriers to entry level and trend
- Substitutes level and trend
- Buyer power level and trend
- Supplier power level and trend
Charts
- Market share concentration among the top 4 suppliers from 2020-2025
- Supply chain including upstream supplying industries and downstream buying industries, flow chart
Detailed analysis
- Factors impacting the industry’s level of concentration, such as business distribution, new entrants, or merger and acquisition activity.
- Key success factors for businesses to manage the competitive environment of the industry.
- Challenges that potential industry entrants face such as legal, start-up costs, differentiation, labor/capital intensity and capital expenses.
- Key success factors for potential entrants to overcome barriers to entry.
- Competitive threats from potential substitutes for the industry’s own products and services.
- Key success factors for how successful businesses can compete with substitutes.
- Advantages that buyers have to keep favorable purchasing conditions.
- Advantages that suppliers have to maintain favorable selling conditions.
- Key success factors for how businesses can navigate buyer and supplier power.
Companies
Learn about the performance of the top companies in the industry.
Analyst insights
Vista Outdoor has sold its firearms business. The Kinetic Group, now part of a larger holding group, represents a major competitor in small arms, especially in civilian marke...
In this chapter
- Market Share Concentration
- Companies
- Company Spotlights
Charts
- Industry market share by company in 2021 through 2025
- Major companies in the industry, including market share, revenue, profit and profit margin in 2025
- Overview of Olin Corporation's performance by revenue, market share and profit margin from 2019 through 2025
- Overview of General Dynamics Corporation's performance by revenue, market share and profit margin from 2019 through 2025
- Overview of The Kinetic Group's performance by revenue, market share and profit margin from 2019 through 2025
- Overview of revenue, market share and profit margin trend for 2 additional companies
Detailed analysis
- Description and key data for Olin Corporation, and factors influencing its performance in the industry
- Description and key data for General Dynamics Corporation, and factors influencing its performance in the industry
- Description and key data for The Kinetic Group, and factors influencing its performance in the industry
- Description, key data and performance trends for 2 additional companies
External Environment
Understand the demographic, economic and regulatory factors that shape how businesses in an industry perform.
Analyst insights
The industry faces massive regulation. Companies face severe restrictions on gun sales in civilian markets, import/export restrictions in defense and dual use markets, enviro...
In this chapter
- External Drivers
- Regulation & Policy
- Assistance
Key metrics
- Regulation & policy level and trend
- Assistance level and trend
Charts
- Regulation & Policy historical data and forecast (2015-2030)
- Assistance historical data and forecast (2015-2030)
Detailed analysis
- Demographic and macroeconomic factors influencing the industry, including Regulation & Policy and Assistance
- Major types of regulations, regulatory bodies, industry standards or specific regulations impacting requirements for industry operators
- Key governmental and non-governmental groups or policies that may provide some relief for industry operators.
Financial Benchmarks
View average costs for industry operators and compare financial data against an industry's financial benchmarks over time.
Analyst insights
Manufacturers effectively manage cost increases by passing them on to consumers. Due to the inelastic nature of demand, especially in defense markets, manufacturers maintain ...
In this chapter
- Cost Structure
- Financial Ratios
- Key Ratios
Key metrics
- Profit margin, and how it compares to the sector-wide margin
- Average wages, and how it compares to the sector-wide average wage
- Largest cost component as a percentage of revenue
- Industry average ratios for days' receivables, industry coverage and debt-to-net-worth ratio
Charts
- Average industry operating costs as a share of revenue, including purchases, wages, depreciation, utilities, rent, other costs and profit in 2025
- Average sector operating costs as a share of revenue, including purchases, wages, depreciation, utilities, rent, other costs and profit in 2025
- Investment vs. share of economy
Data tables
- Industry Multiples (2018-2023)
- Industry Tax Structure (2018-2023)
- Income Statement (2018-2023)
- Balance Sheet (2018-2023)
- Liquidity Ratios (2018-2023)
- Coverage Ratios (2018-2023)
- Leverage Ratios (2018-2023)
- Operating Ratios (2018-2023)
- Cash Flow & Debt Service Ratios (2015-2030)
- Revenue per Employee (2015-2030)
- Revenue per Enterprise (2015-2030)
- Employees per Establishment (2015-2030)
- Employees per Enterprise (2015-2030)
- Average Wage (2015-2030)
- Wages/Revenue (2015-2030)
- Establishments per Enterprise (2015-2030)
- IVA/Revenue (2015-2030)
- Imports/Demand (2015-2030)
- Exports/Revenue (2015-2030)
Detailed analysis
- Trends in the cost component for industry operators and their impact on industry costs and profitability
Key Statistics
Industry Data
Data Tables
Including values and annual change:
- Revenue (2015-2030)
- IVA (2015-2030)
- Establishments (2015-2030)
- Enterprises (2015-2030)
- Employment (2015-2030)
- Exports (2015-2030)
- Imports (2015-2030)
- Wages (2015-2030)
Top Questions Answered
Unlock comprehensive answers and precise data upon purchase. View purchase options.
What is the market size of the Guns & Ammunition Manufacturing industry in the United States in 2026?
The market size of the Guns & Ammunition Manufacturing industry in the United States is $23.5bn in 2026.
How many businesses are there in the Guns & Ammunition Manufacturing industry in the United States in 2025?
There are 738 businesses in the Guns & Ammunition Manufacturing industry in the United States, which has grown at a CAGR of 3.2 % between 2020 and 2025.
How may import tariffs affect the Guns & Ammunition Manufacturing industry in the United States?
The Guns & Ammunition Manufacturing industry in the United States is likely to be impacted by import tariffs with imports accounting for a moderate share of industry revenue.
How may export tariffs affect the Guns & Ammunition Manufacturing industry in the United States?
The Guns & Ammunition Manufacturing industry in the United States is likely to be impacted by export tariffs with exports accounting for a moderate share of industry revenue.
Has the Guns & Ammunition Manufacturing industry in the United States grown or declined over the past 5 years?
The market size of the Guns & Ammunition Manufacturing industry in the United States has been growing at a CAGR of 1.6 % between 2020 and 2025.
What is the forecast growth of the Guns & Ammunition Manufacturing industry in the United States over the next 5 years?
Over the next five years, the Guns & Ammunition Manufacturing industry in the United States is expected to grow.
What are the biggest companies in the Guns & Ammunition Manufacturing industry in the United States?
The biggest companies operating in the Guns & Ammunition Manufacturing industry in the United States are Olin Corporation, General Dynamics Corporation and The Kinetic Group
What does the Guns & Ammunition Manufacturing industry in the United States include?
Machine guns manufacturing and Shotguns and rifles manufacturing are part of the Guns & Ammunition Manufacturing industry in the United States.
Which companies have the highest market share in the Guns & Ammunition Manufacturing industry in the United States?
The company holding the most market share in the Guns & Ammunition Manufacturing industry in the United States is Olin Corporation.
How competitive is the Guns & Ammunition Manufacturing industry in the United States?
The level of competition is moderate and steady in the Guns & Ammunition Manufacturing industry in the United States.
Methodology
How are IBISWorld reports created?
IBISWorld has been a leading provider of trusted industry research for over 50 years to the most successful companies worldwide. With offices in Australia, the United States, the United Kingdom, Germany and China, we are proud to have local teams of analysts that conduct research, data analysis and forecasting to produce data-driven industry reports.
Our analysts start with official, verified and publicly available sources of data to build the most accurate picture of each industry. Analysts then leverage their expertise and knowledge of the local markets to synthesize trends into digestible content for IBISWorld readers. Finally, each report is reviewed by one of IBISWorld’s editors, who provide quality assurance to ensure accuracy and readability.
IBISWorld relies on human-verified data and human-written analysis to compile each standard industry report. We do not use generative AI tools to write insights, although members can choose to leverage AI-based tools within the platform to generate additional analysis formats.
What data sources do IBISWorld analysts use?
Each industry report incorporates data and research from government databases, industry-specific sources, industry contacts, and our own proprietary database of statistics and analysis to provide balanced, independent and accurate insights.
Key data sources in the US include:
- US Census Bureau
- US Bureau of Labor Statistics
- US International Trade Commission
Analysts also use industry specific sources to complement catch-all sources, although their perspective may focus on a particular organization or representative body, rather than a clear overview of all industry operations. However, when balanced against other perspectives, industry-specific sources provide insights into industry trends.
These sources include:
- Industry and trade associations
- Industry federations or regulators
- Major industry players annual or quarterly filings
Finally, IBISWorld’s global data scientists maintain a proprietary database of macroeconomic and demand drivers, which our analysts use to help inform industry data and trends. They also maintain a database of statistics and analysis on thousands of industries, which has been built over our more than 50-year history and offers comprehensive insights into long-term trends.
How does IBISWorld forecast its data?
IBISWorld’s analysts and data scientists use the sources above to create forecasts for our proprietary datasets and industry statistics. Depending on the dataset, they may use regression analysis, multivariate analysis, time-series analysis or exponential smoothing techniques to project future data for the industry or driver. Additionally, analysts will leverage their local knowledge of industry operating and regulatory conditions to impart their best judgment on the forecast model.
IBISWorld prides itself on being a trusted, independent source of data, with over 50 years of experience building and maintaining rich datasets and forecasting tools. We are proud to be the keystone source of industry information for thousands of companies across the world.
Learn more about our methodology and data sourcing on the Help Center.


