
IBISWorld Platform
Answer any industry question in minutes with our entire database at your fingertips.

The US incarceration rate is estimated at 365.8 people per 100,000 in 2026, representing a 3.0% decrease from 2025. This reflects policy changes, expanded early-release pathways and sustained declines in crime. While violent crime rates have decreased, reforms at the state and federal levels have driven the reduction in the incarcerated population. Public health concerns, such as infectious disease risks in correctional facilities, amplify these policy effects.From 2021 to 2026, the incarceration rate faced significant volatility, though it ultimately grew at an annualized rate of 0.2%. In 2021, prison populations continued their pandemic-driven decline, dropping by 1.5%, as state and federal courts paused non-essential and non-emergency proceedings. At this time, authorities also prioritized releasing low-risk individuals and opting for supervision instead of incarceration for nonviolent offenders.However, as courts began reopening and previously backlogged trials were processed, the incarceration rate rose. In 2022, new prison admissions were 11.0% higher than in 2021, according to the Bureau of Justice Statistics (BJS), while releases only increased by 1.0%, so net prison populations rose. Similarly, many areas curtailed jailing people for technical or low-level crimes during the pandemic; the reversal of those practices contributed to growth in the population rate. As a result, from 2022 through 2024, the incarceration rate grew by 1.7%, 1.5% and 4.0%, respectively. In 2025, as pandemic-related disruptions subsided, the incarceration rate returned to its downward trend, dropping by 3.1%. The incarceration rate has continued to remain well below pre-pandemic levels.Throughout this period, state-level justice reinvestment initiatives have played a pivotal role in bending the curve. More than 30 states have used justice reinvestment strategies to reduce prison populations and redirect savings into community corrections, treatment, and reentry services, collectively averting billions in projected corrections costs. Federal legislation, such as the First Step Act and subsequent rule changes, has further reduced the federal prison population by expanding earned-time credits and early-release opportunities, though federal inmates represent a relatively small share of the total.
Curious about what drives these trends? IBISWorld's analyst coverage on the incarceration rate includes detailled analysis on the current performance, outlook and industries affected.
1980-2032
The incarceration rate represents the number of sentenced inmates currently incarcerated under state and federal jurisdiction per 100,000 citizens. Data is sourced from the US Department of Justice and only includes prison-only inmates, excluding local jails.
IBISWorld Industry Reports are available in multiple formats to fit seamlessly into your workflow.

Answer any industry question in minutes with our entire database at your fingertips.
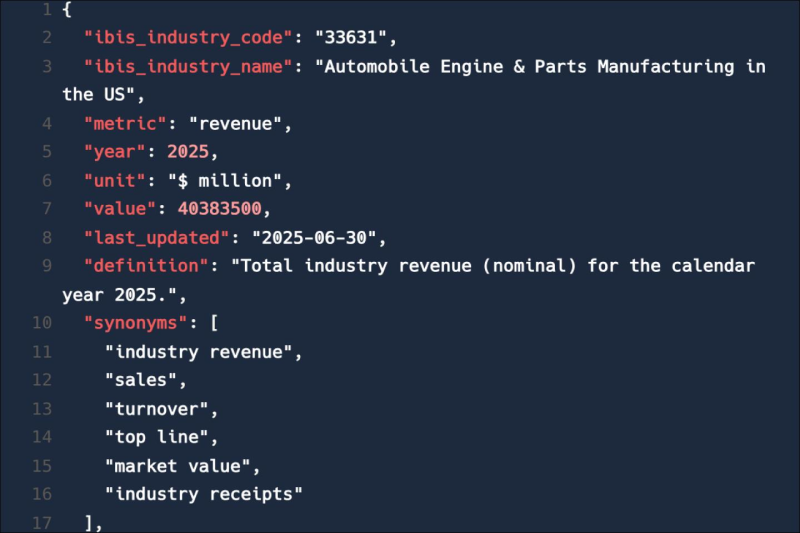
Feed trusted, human-driven industry intelligence straight into your platform.
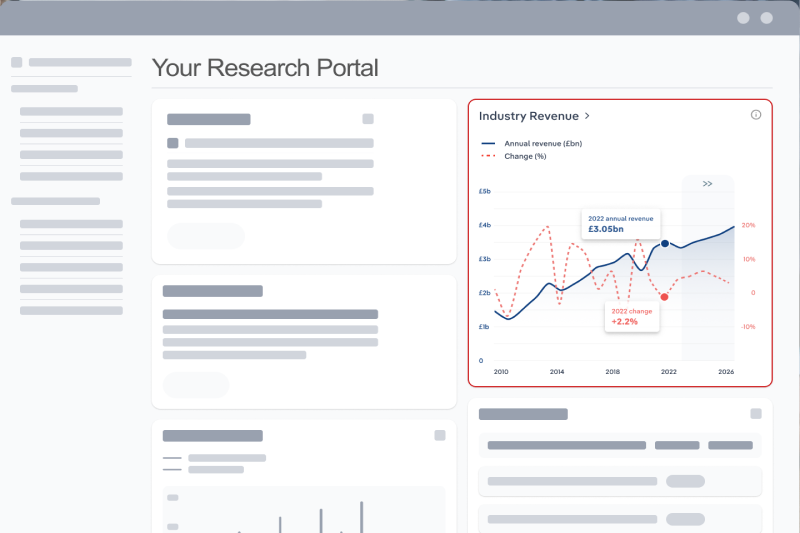
Streamline your workflow with IBISWorld’s intelligence built into your toolkit.
Explore industries with similar markets, supply chains, and economic drivers to gain broader context and insights.
| Industry | Country | Last 5-yr CAGR | Forecast 5-year CAGR | Revenue |
|---|---|---|---|---|
| Correctional Facilities in the US |

|
XX% | XX% | $XX |
| Court Reporting Services in the US |
|
XX% | XX% | $XX |
| Forensic Technology Services in the US |
|
XX% | XX% | $XX |
| Toxicology Laboratories in the US |
|
XX% | XX% | $XX |
When the stakes are high, you need intelligence that cuts through the noise—wherever you work.
The incarceration rate in the US in 2026 was 365.84 people.
The incarceration rate in the US grew by 0.16% in 2026.
IBISWorld’s data and analysis on incarceration rate in the US includes forecasted growth rates over the next five years.