Key Takeaways
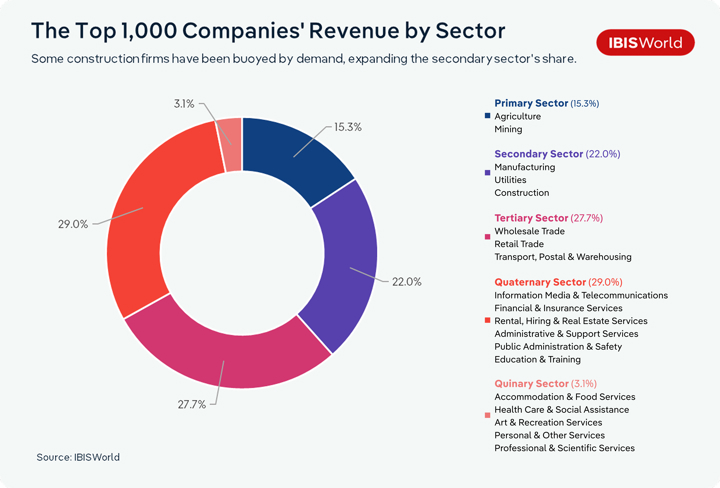
- The IBISWorld 2026 Top 1,000 Companies List provides in-depth insights across over 300 industries, which have collectively generated $2.98 trillion in revenue.
- Companies dealing in precious metals like gold and silver have experienced a significant boom over the last year, as prices have surged to meet demand.
- The tech sector is navigating mixed experiences, with companies reporting strong growth, but also cutting employees as AI evolves their operations.
- Casinos have come under significant government scrutiny as investigations into their operations take place.
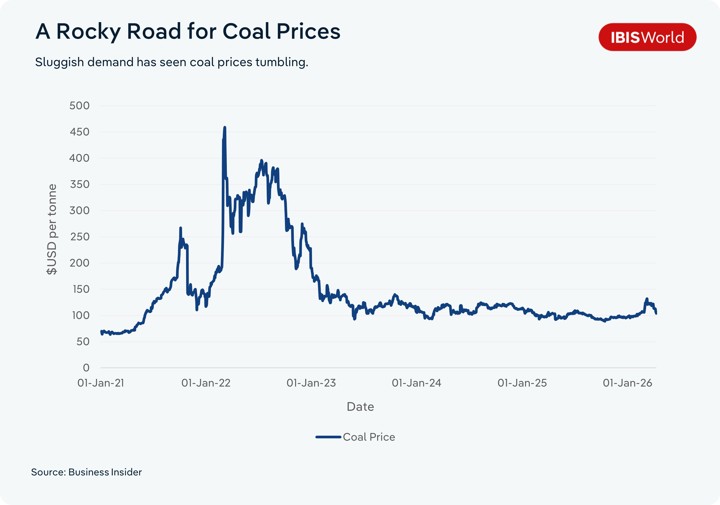
- Tumbling coal prices, following lower demand from major markets and a continued transition to clean energy alternatives, have seen many mining companies slide.
- Tariffs and trade wars have induced significant volatility across industries. Companies involved in international trade have had to navigate unpredictable market conditions.
IBISWorld’s 2026 Top 1,000 AU and NZ Companies offers a comprehensive ranking of the highest-grossing companies across 300 industries, excluding government entities and not-for-profit organisations. This special report provides an in-depth look into the trends and insights emerging from the top performers across Australia and New Zealand.
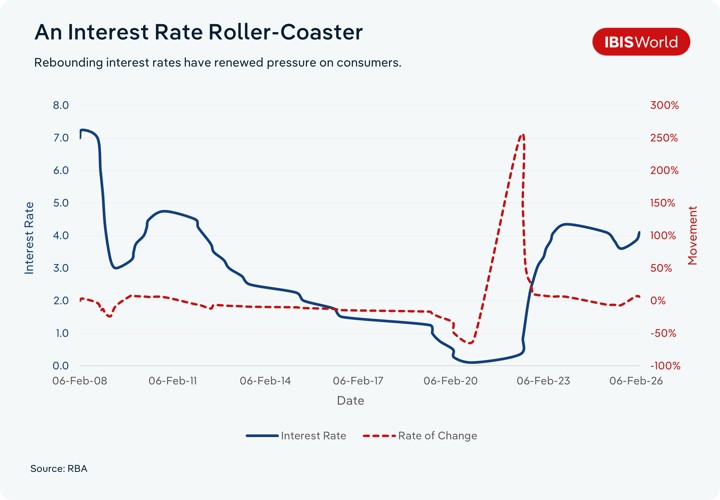
The 2024-25 financial year saw elevated interest rates, despite a brief respite from the Reserve Bank, which cut rates three times in the 2025 calendar year. Persistent inflation and a cost-of-living crisis saw companies across all industries see their performance impacted.
In the face of these challenges, the companies in the list collectively generated $2.98 trillion in revenue, marking steady growth of 2.92% compared to the previous year’s list.
This year saw the top players continue to build on their performances last year, with global economic and geopolitical tensions providing growth opportunities for some while hindering others. The usual suspects dominate the Top 1,000 list, once again. Rio Tinto Limited and BHP lead the way, followed by the four major banks, led by Commonwealth Bank of Australia, and the major supermarkets. Insurance companies, energy giants and telecom and health businesses also feature highly in the list. Rio Tinto topped the rankings, reporting $88.2 billion in revenue for the year ended December 2025, with its closest rival, BHP, reporting $80.2 billion for the year ended June 2025. Both mining giants reported lower revenue from iron ore once again, as prices for the commodity have dropped in recent years. However, gains in revenue from the copper, aluminium and lithium business segments have helped offset this impact.
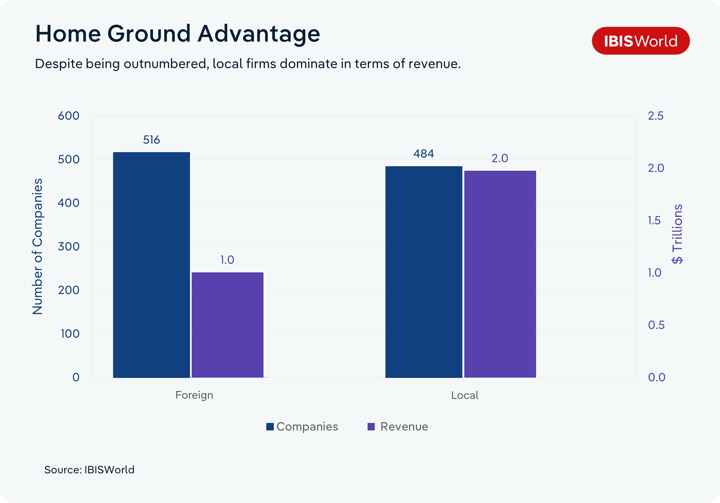
Foreign-owned companies outnumber local companies in this year's list, though the split was close to 50:50. Despite the number of entrants being similar, local companies dominated the share of revenue, accounting for 66.31%
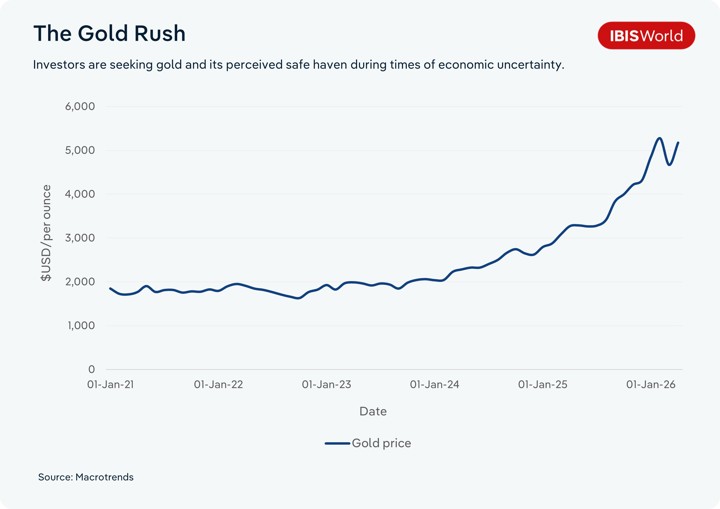
The Gold Rush
Throughout 2024-25, the prices of precious metals like gold and silver surged. Data from Trading Economics shows gold prices skyrocketed from just over US$2,000 per ounce in January 2024 to well over US$4,300 by the end of December 2025, rising to over US$5,000 in early 2026. Several factors fuelled this spectacular rise, primarily US interest rate cuts, which made metals like gold more attractive than bonds and cash. The United States unleashed a wave of tariffs in early 2025, following President Donald Trump’s re-election, triggering a shift away from investing in shares and pushing people to seek the perceived safe-haven of gold. Meanwhile, industrial demand gave silver a significant boost – its use in electronics and automobiles made it doubly attractive to investors, as its price more than doubled in 2025.
Pallion Group Pty Ltd reported a near doubling of its revenue for the year ending June 2025. This saw the company, operating in the Gold & Other Nonferrous Metal Processing industry, climb 31 places in the list this year, ranking at 26. The list also features Newmont International Holdings Pty Ltd as a new entrant, with revenue jumping 443.6% in the year ending December 2024, placing the company in 77th place. Both these enterprises, along with many other businesses that are involved in gold mining and processing, experienced the positive flow-on effects of the gold rush.
Tech Talk
Tech companies across Australia and New Zealand showed mixed results in this year’s list. Major companies like Apple and Microsoft have made marginal gains, while cloud hosting and data processing service providers like NTT Australia and Datacom Group slipped down the pecking order. Hewlett-Packard South Pacific Pty Ltd was one of the biggest sliders, dropping 26 places to 662, following a near 30% drop in revenue for the year ending October 2024. The parent entity, Global HP Inc., noted a sluggish market for PCs and printing services, partially due to a post-pandemic boom running out of steam, while demand for consumer devices, a key product for the Australian business, declined.
Atlassian was one of the major winners during 2024-25. The company reported a significant revenue upturn, rising nearly 20.0% for the year ended June 2025. It noted strong subscription revenue performance, with its annual report stating that increased subscription revenue, up 26.0% in the year, came from paid seat expansion from existing customers and price increases. Notably, soon after these results, Atlassian announced in March 2026 that it was cutting around 1,600 jobs, or 10.0% of its global workforce, to reallocate resources towards AI and enterprise sales. Around 500 of these redundancies will be made in Australia. This trend of tech companies cutting jobs and focusing on AI has recently become prevalent, with Microsoft, Amazon and Oracle all slashing thousands of roles globally over the past year as they prepare for expected AI efficiency gains.
Casino Royale
The list features three casino operators this year, two of which have taken a tumble. Over the past few years, casinos across Australia have come under significant government scrutiny, as issues of anti-money laundering compliance, governance failures and a broader push for gambling reform have attracted attention. Crown has seen its Melbourne and Perth casinos subject to enforcement investigations by the Australian Transaction Reports and Analysis Centre in recent years. The Victorian Royal Commission found Crown Melbourne to be unsuitable to continue operating with a casino licence in October 2021. It identified illegal gambling practices, misleading regulators and failure to make appropriate tax payments as key reasons for its decision. A similar fate befell Crown Perth in 2022 following the Perth Casino Royal Commission that year. In both cases, a two-year period under oversight was granted to the casinos to transform their practices, along with a total fine of $450 million. Crown has since acknowledged that it’s undergoing changes to improve its practices, like governance, risk and harm-minimisation initiatives.
According to its annual report, Star Entertainment is also implementing its remediation plan following two inquiries in recent years to maintain casino licences in New South Wales and Queensland. As of April 2026, the Star Sydney, Gold Coast and Brisbane casino licenses remain suspended while they undergo transformative practices and operate under a special manager. The scrutiny has negatively impacted the performance of these casino operators, with only Crown achieving a marginal 2024-25 revenue gain and Star Entertainment experiencing a downturn, resulting in the company’s slide down the Top 1,000 list.
Trade Wars
Led by the United States, 2024-25 saw significant trade tensions, like tariffs and retaliatory measures. The introduction of 10.0% baseline tariffs on most imported goods to the United States from April 2025 onwards, along with reciprocal tariffs at varying rates, sent supply chains into chaos. Most Australian and New Zealand exports to the United States were impacted, and with varying abilities to pass them on to customers, companies absorbed the brunt of the increases, reducing sales, revenue and profit margins. These measures have influenced the company's ranking in this year’s Top 1,000 list.
In its 2025 annual report, BlueScope Steel noted that economic uncertainty and US trade policy in 2024-25 impacted its performance, with US steel prices rising in the second half of 2024-25 following the introduction of tariffs. It also noted that the policy shift disrupted its coated products business in the United States, slowing expansion efforts. Its Australia and New Zealand operations also suffered from lower global steel prices, despite higher production volumes. This saw the company fall eight spots in the Top 1,000 list, to rank 34.
A Rough Harvest
Globally, prices for some staple crops like corn, wheat and soybeans experienced a sustained downturn in 2024, receding to levels last seen in 2020. The price drops can be attributed to improved global supply and softer demand from major consumers like China. These factors led companies in the Top 1,000, like GrainCorp Limited and COFCO International Australia, to report significantly weaker revenue and margins during 2023-24. A price recovery in 2025 has helped some companies, like GrainCorp, which posted an 11.9% improvement in revenue for the year ended September 2025, resulting in a slight rankings climb. COFCO International Australia Pty Ltd’s ranking took a hit, as the latest available results, from December 2024, see its revenue down 49.9% through 2023, dropping it 183 spots.
Constructive Feedback
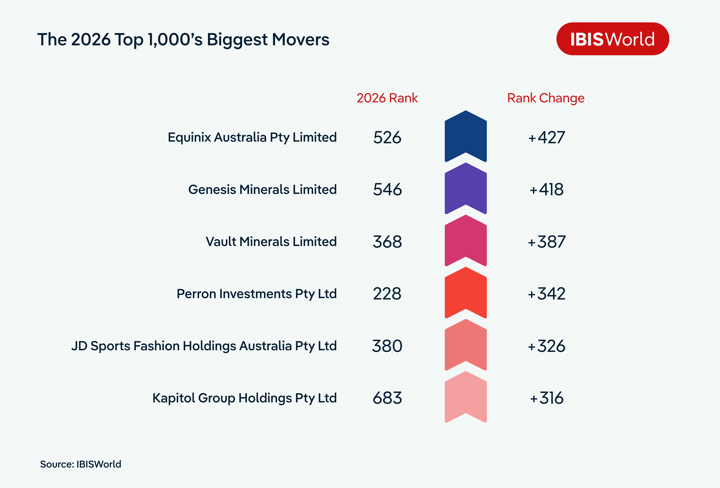
The benefits of operational efficiency have been evident across many industries, especially for companies in commercial and industrial building construction. Built Construction Holdings Pty Limited and Kapitol Group Holdings Pty Ltd are two companies that have leapfrogged in this year's list. Built saw a 54.4% improvement in revenue, jumping 122 spots to 171st, while Kapitol rose by an astonishing 316 spots to rank 683rd, with the company seeing most of its gain in the 2023-24 period, results which weren’t available for last year’s list. Both companies have attributed their growth to operational efficiency gains from investments in productivity systems and technology, and de-risking and diversification strategies. An expanding industrial sector and projects related to data centres health, defence and social infrastructure.
Data centres in particular have been a focus area for both state and federal governments, as nations look to solidify data sovereignty and drive economic growth through AI. Built’s undertaking of a CDC data centre in Laverton, VIC, currently under construction, will continue to contribute to the company’s rapid rise.
A Rocky Road for Coal
In the last couple of years, coal prices have tumbled drastically, following a sharp price hike at the onset of the Russia-Ukraine war. According to data from Trading Economics, coal was trading at around US$400 per tonne in January 2023, before tumbling to just over US$100 per tonne in December 2025. The initial price surge came as the conflict between Russia and Ukraine disrupted major supply chains. Russia accounted for approximately 18.0% of global thermal coal exports and 9.0% of global metallurgical coal exports. Additionally, the country also supplied 17.0% of global natural gas production. The sanctions on Russian exports significantly disrupted supply chains, leading to shortages of energy commodities and pushing up prices over the two years through 2022-23.
Sluggish demand from major downstream markets like China, which has seen its property sector struggle over the past few years, has coincided with oversupply, leading to large coal stockpiles in the country amid lower demand and increased domestic production. Along with the continued transition to clean energy alternatives like renewables, coal prices have depressed rapidly between 2023-24 and 2025-26. Companies in the list, like Peabody Australia and Mitsui Resources, experienced falling coal sales over the two years through 2024-25, with Mitsui reporting falling coking and thermal coal sales. This has seen both companies slide down this year's Top 1,000 list.
Cost-Of-Living Tears Clothing Retailers
Elevated interest rates, persistent inflationary pressures and a cost-of-living crisis in Australia have been common talking points over the past few years. Interest rates surged following the pandemic as rampant inflation forced the RBA to enact strict monetary policy. Despite relief from three rate cuts in 2025, the challenging economic environment has put pressure on many industries, like clothing retailers, as consumers saw their real household discretionary incomes shrink between 2020-21 and 2025-26. This year's list sees many companies in the industry fall down the rankings as revenue gains were marginal to negative for companies like Cettire, Country Road and The Iconic.
A Growth Story
One of the success stories in this year's Top 1,000 list is Veolia. The company jumped 274 spots in the list to 152, following a 182.1% revenue spike. The company has benefited from its 2020-21 merger with Suez and the acquisition of its Australian waste operations, boosting revenue in the years that followed. The acquisitions of Comgen Australia Pty Ltd, Veolia Water Australia Pty Ltd and Veolia Energy Services Pty Ltd in December 2023 and of Veolia Recycling & Recovery Holdings ANZ Pty Ltd in January 2023 have supported continued growth for the Environmental Science Services giant. The contribution from these entities has been fully incorporated into the latest financial statements for the year ending December 2024, contributing to the mammoth climb in rankings.
Final Word
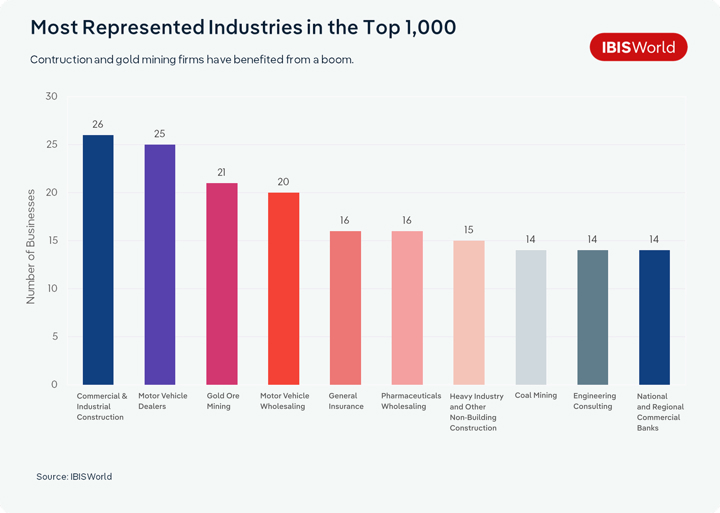
IBISWorld’s 2026 Top 1,000 list shows overall revenue growth from the previous year. Australia’s Commercial and Industrial Building Construction industry is once again the most represented in the list, with 26 entrants and revenue totalling $41.2 billion. Built Construction Holdings Pty Limited was the biggest industry improver with 54.4% jump in revenue over the year. Most commercial and industrial building construction companies rose up the rankings on the back of a push in various industrial projects like new data centres across the country.
Blue chip companies and established industries across mining, banking, general insurance and supermarkets continue to lead the way, with major rank changes uncommon across the top 100 companies. Gold ore miners have experienced a rich vein of form, posting sharp gains in 2024-25 as investors sought a safe haven in the precious metal amid global economic volatility.
A wave of RBA rate cuts in 2025 limited banks' gains, but persistent inflation and the outbreak of a large-scale conflict between Iran, Israel and the United States in early 2026 flipped the script, leading to a rate hike in March 2026. This economic volatility will be reflected across all sectors in 2025-26, significantly influencing company performance.
Geopolitical tension, like the recent escalation in the Middle East, along with existing conflicts in Europe, will have negative impacts on input costs, especially oil and gas. Given the necessity of these resources across the supply chain, companies across all industries will have their revenue generation capabilities restricted, while looking to improve operational efficiency and pass on costs to customers to maintain margins.
Government measures to improve fuel security will add more pressure on the national debt and will see effects flow through to policy, eventually hurting Australians’ back pockets. A surge in electric vehicles will benefit the motor vehicle industry, offsetting a slowdown in demand for cars with traditional internal combustion engines. Defence and tech firms will look to capitalise on evolving global situations by developing advanced technologies and AI.
A volatile 12 months has shaped this year’s Top 1,000, with developments in early 2026 likely to see similar challenges and opportunities for companies in the years ahead.