Key Takeaways
- Use IBISWorld’s Industry Wizard to screen markets with scalable labor conditions, not just strong growth.
- Evaluate wage intensity, profitability and revenue per employee to surface execution risk.
- Build scorecards and visual outputs that align stakeholders around the markets your team can scale confidently.
When strategy teams identify a new market, the focus often starts with opportunity size. Is demand growing? Is the industry or sector expanding? Is there room to scale? But these signals don’t always tell the full story.
In workforce-constrained industries, growth potential can be quickly undermined by practical barriers: limited staffing capacity, rising labor costs or inefficient operating models. Markets that look viable on paper often carry hidden costs or delivery challenges that don’t show up until execution is already underway.
That’s why many teams use IBISWorld early in their planning process, not just to spot opportunity, but to filter for scalability.
Let’s explore how our tools help users to:
- Shortlist industries with stable labor conditions and realistic hiring potential.
- Compare cost structures and productivity to assess operational efficiency.
- Build data-backed strategies that align opportunity with capacity.
Why execution risk deserves a seat at the table
Strong demand doesn’t guarantee scalability. Strategy teams can pour time into markets with impressive top-line potential, only to find they’re difficult to serve at scale. This could be due to staffing shortages, high wage intensity or fragmented supply chains.
Labor constraints are often the root cause. They can slow rollout, stretch internal capacity and quietly erode margins. Because they rarely appear in headline forecasts, they’re easy to miss in early-stage planning.
Growth signals can point to promising markets, but without the right labor conditions in place, delivery can fall short. That’s where labor benchmarks become essential. By assessing workforce trends and operating pressures early, strategy teams can move beyond momentum and focus on markets where execution is feasible, and effort translates into results. After all, in any industry, you can’t outperform structural constraints. If the entire economy or industry is facing labor shortages, high turnover, or wage inflation, you’re still stuck competing in that environment. Strategy is not immune to this issue.
That’s why the first step many teams take is to use our Industry Wizard to screen for industries with the right labor and performance profile, before strategy moves into planning mode.
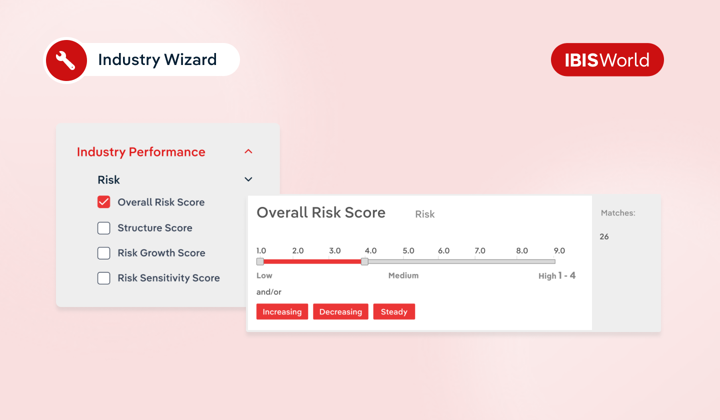
Step one: Filter for scalable markets using the Industry Wizard
Top-line growth can be enticing, but without a clear view of labor conditions, execution may fall apart before momentum builds. The Industry Wizard helps teams move beyond surface-level promise by screening for industries where both demand and delivery capacity are aligned.
This step allows planners to trim down a broad list of industries into a sharper shortlist, using filters that reflect both opportunity and operational viability. Unlike a basic trend Google search, the tool lets you screen for structural enablers (labor availability, cost pressure and market scale) that directly affect execution.
Let’s walk through how one team refined their expansion targets using the Industry Wizard, landing on Payment Systems in the UK as a strong candidate.
Starting with sustainable employment growth
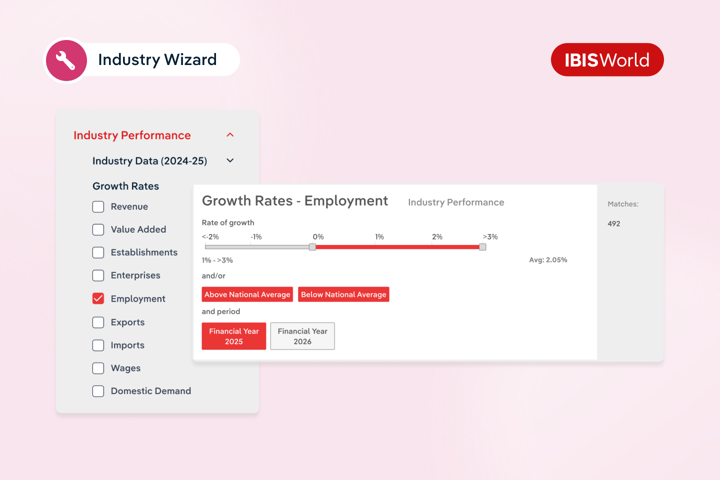
The team begins by applying a forecast employment growth filter. They’re looking for industries where the workforce is expanding at a healthy rate. So, enough to support future hiring but not so overheated that it triggers wage blowouts or long lead times.
Payment Systems stands out with a projected employment growth rate of 3.49%. It signals a positive hiring environment and steady workforce availability, without the staffing risks seen in some emerging or highly specialized sectors.
Screen for wage stability
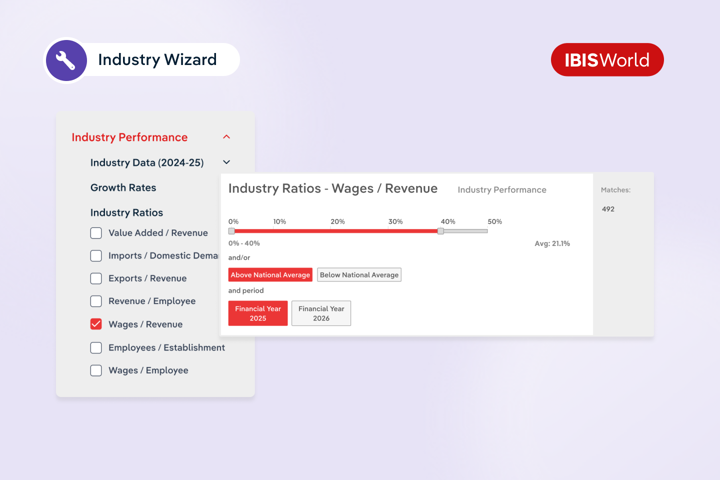
Next, the team applies a wage intensity filter, looking at wages as a percentage of revenue. This helps quickly rule out labor-heavy sectors where staff costs could eat into margins.
Payment Systems shows a wage-to-revenue ratio of 12.61%, signaling a leaner cost structure than many people-focused or service-heavy sectors. While this industry still depends on specialized staff, its relatively low wage intensity suggests margin pressure is less likely to become a roadblock.
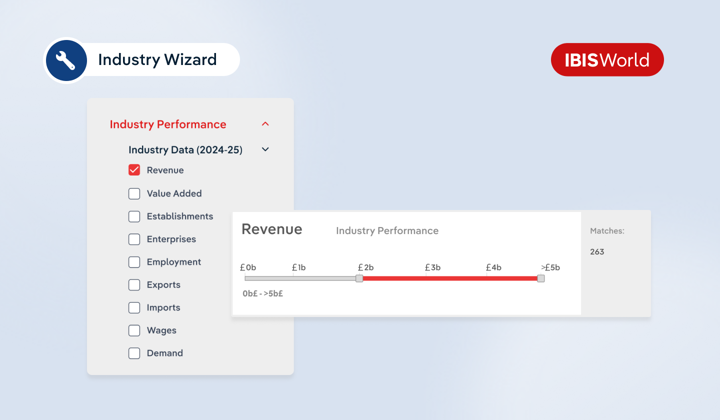
Set a revenue threshold
To avoid targeting fragmented markets with limited room to scale, the team sets a minimum revenue threshold of £1 billion. Payment Systems clears this easily, with industry revenue sitting at £9.7 billion. That positions it as large enough to justify resourcing, while still offering room for meaningful growth.
Check risk profile
To round out their filtering, the team reviews the industry’s risk indicators. Payment Systems shows a low overall risk level with a steady trend – a reassuring sign that the operating environment is unlikely to shift unexpectedly. Compared to other shortlisted industries with rising risk scores or higher volatility, Payment Systems stands out as a more dependable choice.
Refining the list
With these four filters, the team trims their broad list of potential industries down to a focused shortlist:
- Employment growth: To find markets with strong but stable hiring potential.
- Wage intensity: To avoid margin pressure from high labor costs.
- Revenue scale: To focus on markets large enough to justify investment.
- Risk profile: To eliminate volatile or operationally uncertain sectors.
Payment Systems remains on the list, while several high-growth but high-risk industries are removed due to margin concerns or elevated volatility. The result is a focused, defensible starting point. With fewer operational unknowns, the team can move forward with greater confidence into deeper benchmarking and planning.
Labor availability directly shapes execution timelines. Even with a promising shortlist, strategy teams still need to assess how quickly and efficiently their organisation, or a target business, can deliver. That’s where deeper performance and cost benchmarks come in.
Step two: Dig deeper with cost structures and productivity metrics
After narrowing down potential industries using high-level filters, the next step is to assess execution feasibility at a deeper level. Even among industries with strong growth and labor conditions, underlying costs and productivity benchmarks can expose stark differences in operational ease and financial return.
This step helps team prioritize where to focus first, by surfacing which markets offer the most scalable returns with the least execution risk.
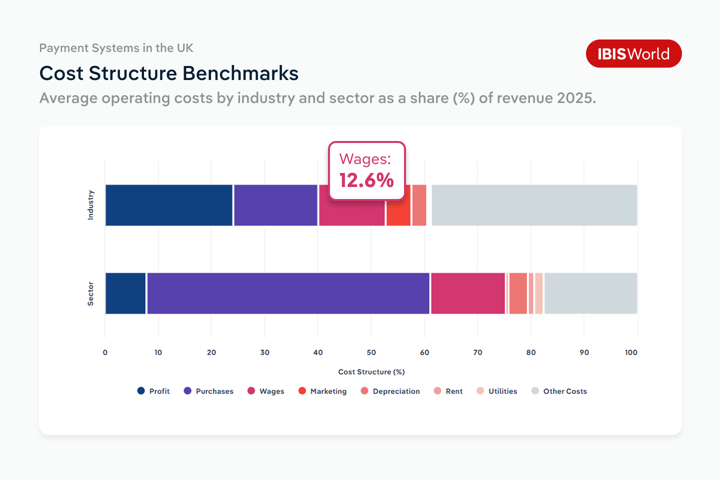
Assess labor costs within the cost structure
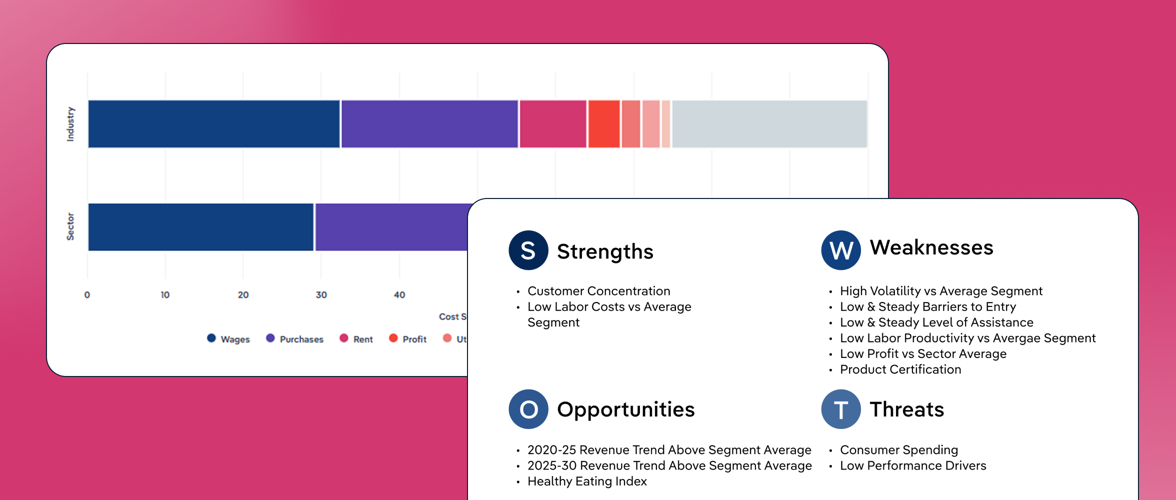
The payment services industry, which made the shortlist in step one, shows clear cost advantages when viewed through the Cost Structure Benchmark. Labor is a key operating cost in most industries, so early visibility into wage intensity is crucial when assessing execution feasibility.
In this case, wages account for just 12.6% of revenue in 2024-45. That’s significantly lower than in many labor-intensive sectors, especially those where staffing costs scale in line with customer demand. For Payment Systems providers, cost-efficiency stems from scalable tech infrastructure. Once core systems are in place, volumes can grow without requiring equivalent increases in headcount.
While companies still rely on highly skilled staff, especially in compliance, cybersecurity and software engineering, wage intensity has declined as automation and digital adoption have accelerated. Absolute wages have risen, but revenue has grown faster, pushing wages down as a share of total costs.
This gives the team confidence: labor costs aren’t likely to undermine margins or execution. The operating model is built for scale.
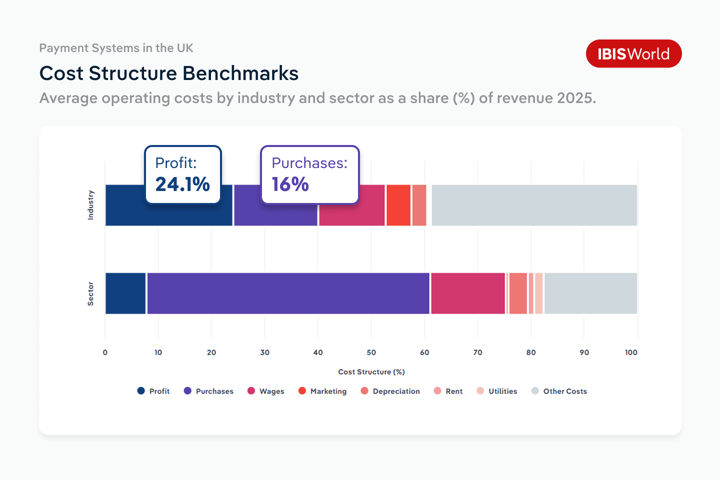
Look at purchases and profitability to flag risk
Payment Systems scores well on profitability, with industry margins sitting at 24.1% in 2024–25, more than triple the broader sector average of 7.85%. High transaction volumes and scalable tech have helped revenue outpace costs, even as companies invest in compliance, cybersecurity and innovation.
Purchase costs are also low by comparison. Purchases account for just 16% of revenue in the industry, while the broader sector average sits at 53.26%. This lean cost base supports stronger returns and gives teams more room to maneuver if conditions change.
Compared to other high-growth markets with thinner margins and higher cost volatility, Payment Systems offers a stronger return profile and greater financial resilience. These differences matter, especially when internal cost-to-serve is already tight.
Even with promising growth, industries with slim margins and elevated costs may struggle to support a scalable strategy.
Evaluate operational productivity
High revenue per employee further strengthens the case for payment systems. Despite being knowledge-intensive, the industry benefits from highly scalable digital infrastructure that allows companies to process growing transaction volumes without proportionate increases in headcount. This signals fewer resourcing hurdles during rollout and stronger returns on internal effort.
For strategy teams, these metrics help with sequencing. Markets that deliver more output per employee are often easier to scale and require fewer upfront resources. When choosing between multiple growth paths, labor productivity can be a critical differentiator, shaping not only which industries get prioritized but also how quickly they can be served.
Step three: Validate and communicate decisions with benchmarking outputs
With both opportunity and execution feasibility assessed, the team’s final task is to present a clear case for action: one that builds internal confidence and accelerates buy-in. Benchmarking outputs help quantify why a market is viable, not just in terms of growth, but through the lens of strategic fit and scalability. Without third-party benchmarks like this, internal metrics can reinforce existing biases or miss emerging risk factors that haven’t yet surfaced internally.
Build prioritization scorecards
To finalize their recommendations, the strategy team builds a prioritization scorecard that ranks shortlisted industries across key filters:
- Employment outlook
- Wage intensity
- Revenue scale
- Profit margin
- Productivity
They combine our data with internal margin and resourcing metrics to score each opportunity.
Payment Systems scores strongly across multiple dimensions: steady labor conditions, rising profitability and scalable operations. While some other industries on the shortlist show higher growth rates, they come with heavier cost-to-serve requirements or more volatile labor conditions.
Compare contenders to validate your recommendation
By the end of step one, the team has trimmed their longlist to 26 industries that meet baseline labor, scale and risk criteria. Among the strongest candidates were Payment Systems and Diagnostic & Ambulance Services, both showing compelling growth signals and substantial market potential.
To pressure-test their thinking, the team compares these two side by side. Diagnostic & Ambulance Services offers consistent demand and scale, but also comes with higher wage intensity and more constrained labor conditions. Payment systems, while more exposed to technological change, demonstrates stronger profit margins, a leaner cost structure and fewer operational constraints.
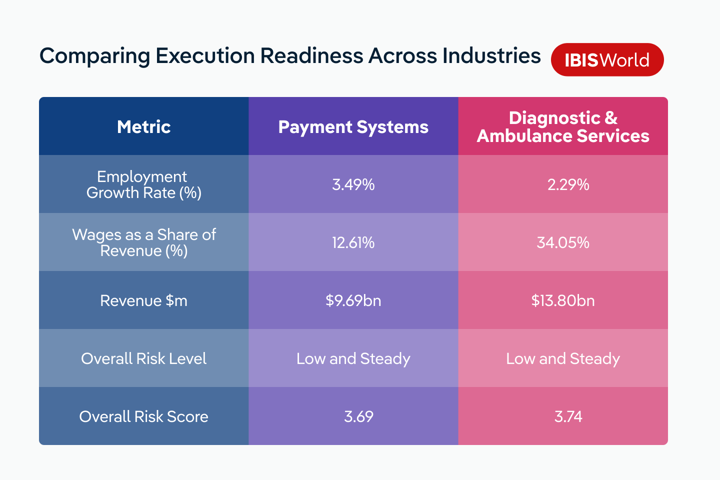
Despite its stable demand profile, Diagnostic & Ambulance Services requires larger staffing inputs and operates under tighter cost pressures. For this team, the comparison reinforces Payment Systems as the more execution-ready option.
Present benchmarks in a stakeholder-ready format
To bring the comparison to life and align decision-makers across strategy, finance and operations, the team builds out several visual outputs using IBISWorld’s benchmarks and forecasts.
These outputs go beyond internal projections to provide a clear, external reference point, helping stakeholders not just where opportunity lies, but how each option stacks up in terms of execution readiness.
Common formats include:
- Heatmaps that compare employment growth and wage intensity across shortlisted industries.
- Benchmarking tables that highlight differences in revenue per employee and wage costs.
- Board-ready slides that combine IBISWorld forecasts with internal capability metrics.
These formats help reframe the conversation from “where’s the biggest opportunity?” to “where can we execute with confidence and scale sustainably?”. External benchmarks play a critical role here. Without them, internal data can reinforce blind spots or miss emerging risks.
Move forward with greater certainty
Backed by data and a validated comparison, the team avoids speculative plays and instead invests in markets with real delivery potential. They don’t just chase growth; they target scale they can serve.
Over time, this approach builds a repeatable process. Strategy teams get faster at identifying viable markets, planning realistic rollouts and allocating resources where they’ll achieve the greatest return.
By embedding IBISWorld’s labor and performance benchmarks into their workflow, they develop a reputation for well-executed growth, anchored in evidence, not instinct.
Final Word
Growth alone doesn’t guarantee success. Without the workforce to support delivery, even strong strategies can struggle to get off the ground.
That’s why strategy teams are using IBISWorld early in the planning cycle—to assess not only market potential, but also the practical realities of execution. By embedding labor and performance benchmarks into their workflow, they build strategies that balance ambition with operational readiness.
For teams looking to go further, IBISWorld’s tools aren’t limited to the Industry Wizard. Benchmarks and filters can be integrated directly into decision engines, dashboards and planning tools via API—streamlining market evaluation and enabling faster, more confident action.
In workforce-constrained environments, alignment like this sets strong strategies apart.