Key Takeaways
- Use the Industry Wizard to identify industries in your portfolio where wage costs are rising faster than output, signaling margin pressure before it shows in the financials.
- Segment Benchmarking reveals strengths and weaknesses by company size, helping you compare borrowers to true peers, rather than industry giants, and uncover viable lending opportunities.
- Key External Drivers, US State and Canadian Provincial reports show whether labor risks are isolated to a borrower or part of a wider trend, so you can make more defensible credit decisions.
Some of the most telling signs of borrower strain aren’t found in the income statement. They’re hidden in stalled recruitment, long-standing vacancies and patchy staffing. While revenue may look stable, the operational momentum behind those numbers can begin slipping long before a ratio turns red.
For lenders, this creates a dangerous blind spot. When credit decisions rely only on historic metrics and topline performance, they risk missing early signals of borrower fragility, which can often be tied to workforce issues.
This is particularly critical in the small business economy. Globally, small businesses account for the overwhelming majority of enterprises:
- 97.2% in Australia,
- 99.09% in the UK,
- 99% in the European Union,
- 98.1% in Canada and,
- 99.9% in the US.
In the US, this figure is growing, with business applications doubling in 2020 and 5 million new businesses starting annually since then.
Smaller businesses with 5-9 employees file more patents per employee than any other size bracket, often representing high-impact growth opportunities. With many banks pursuing mandates to support women and diverse business owners (groups that are more represented at this size), targeted insights become essential. Delivering meaningful support to these borrowers strengthens relationships, opens new lending opportunities and helps banks align strategic growth with social impact.
This article follows a fictional lender, Northline Credit, and credit professional Jamie Chen, as they use IBISWorld’s tools to surface early workforce-related risk and protect portfolio health. Each step draws on real client use cases and practical applications of our Segment Benchmarking, Industry Wizard Tool and Key External Drivers.
Step one: Spot early workforce risks with the Industry Wizard
To stay ahead of margin pressure, Jamie Chen logs into IBISWorld and goes to the Industry Wizard to begin building a custom watchlist. Their goal is to spot which industries in Northline Credit’s portfolio are most exposed to labor-related risk.
They select industry ratios like:
- Wages / Revenue
- Revenue / Employee
- Wages / Employee
These are key indicators of wage intensity and labor efficiency within an industry. Jamie then adds filters under Growth Rates, including employment and wages. These reveal where wage costs are rising faster than output, signaling potential pressure on margins. They also check Overall Risk Score to understand whether these industries are becoming more volatile over time.
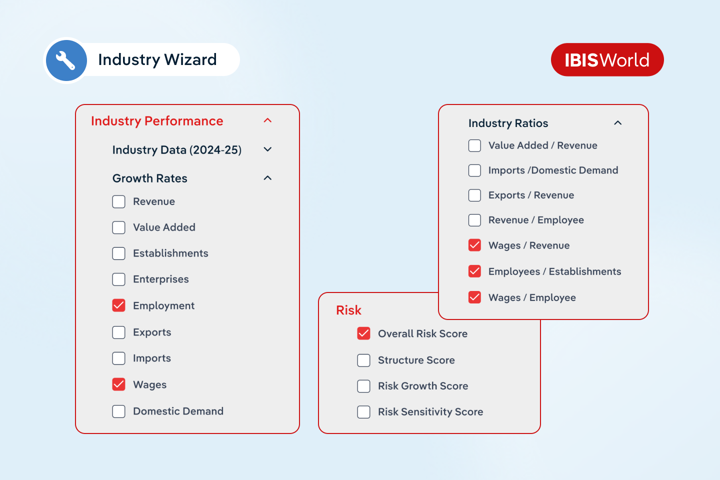
Within seconds, they have a targeted list of high-risk sectors, benchmarked against millions of datapoints.
Why single location restaurants look low risk at first glance
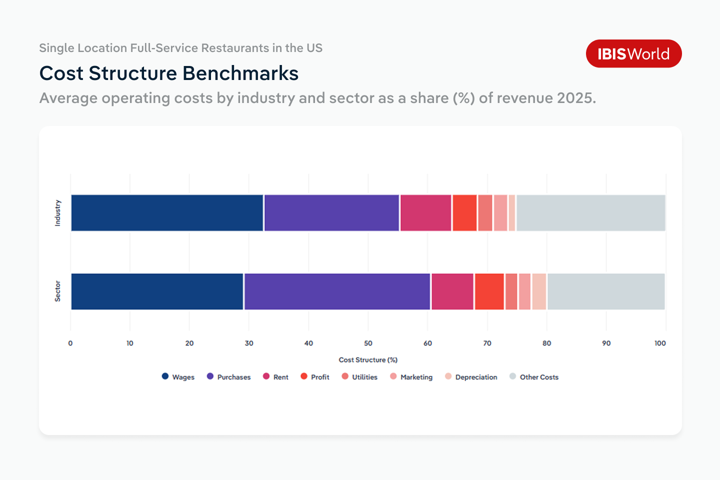
One industry that catches Jamie’s eye is Single Location Full-Service Restaurants in the US. Northline has a number of borrowers within this industry, and at a national level, the industry seems relatively stable:
- Revenue growth has averaged 1.25% annually.
- Wages have grown at a similar pace, rising 1.33% annually.
- Wages account for 32.5% of industry revenue, consistent with a labor-intensive sector.
- The average establishment employs around 19 workers.
On the surface, these figures suggest a large and steady employer with predictable cost structures. But Jamie knows that national averages smooth over the differences between large operators and small independent restaurants, making this a high-priority industry for more nuanced benchmarking.
And Jamie’s not the only one looking closely at this data.
How other lenders are scaling the approach
Other savvy firms are doing the same, and it isn’t just a hypothetical. We’ve seen clients put a similar strategy into action.
One leading financial institution recently built a dashboard for their underwriting department using a custom Wizard search and IBISWorld’s financial ratio data. By combining the results with VLOOKUP, they created a streamlined way to benchmark against customer averages and standardize credit decisions across their portfolio. The outcome? More defensible credit calls, apples-to-apples comparisons and a stronger foundation for portfolio oversight.
For Northline, seeing how other lenders are using Wizard data to create more consistent, informed workflows reinforces Jamie’s approach. But identifying high-risk industries is just the starting point. Next, they need to understand how individual borrowers compare to their true peers.
Step two: Benchmark borrowers against true peers, not industry giants
Many banks run into trouble when assessing borrowers using national industry benchmarks. Depending on the makeup of major companies, these reports can be skewed by dominant players, making it difficult to evaluate smaller firms fairly.
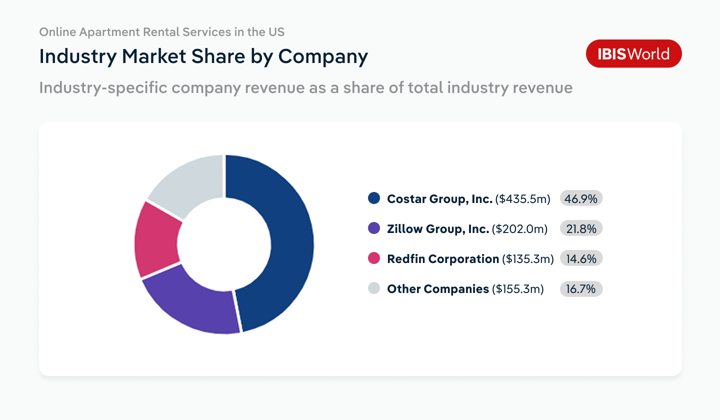
Take the Online Apartment Rental Services in the US for example: over 68% of the market share comes from just two players, Costar Group, Inc and Zillow Group, Inc. Because of this, the national data reflects the cost structure and productivity of corporate giants, not local companies.
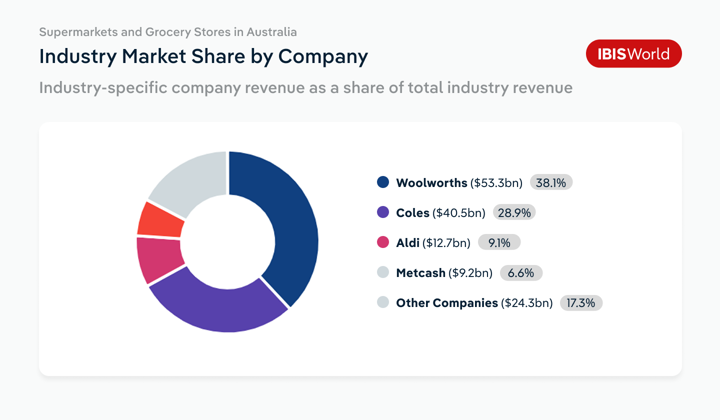
The same dynamic plays out in other geographies. In Australia, for instance, Coles and Woolworths control 67% of the Supermarkets an Grocery Stores industry, distorting benchmarks for independent grocers.
For smaller borrowers, this creates a disadvantage. A bank may decline a loan with a bankable company if their financials don’t meet industry norms when, in fact, the company may be liquid or successful enough for a lending facility in comparison to peers of their size. This can create a competitive disadvantage and can stifle loan growth, especially when nearly all banks have a mandate for commercial and industrial (C&I) growth as interest rates ease.
How segment benchmarks level the playing field
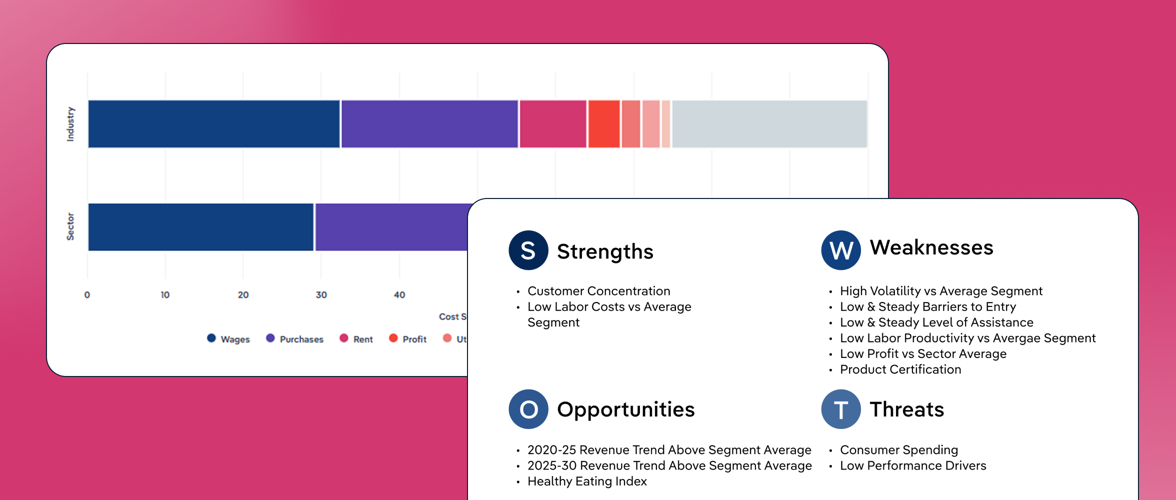
Our Segment Benchmarks break out strengths, weaknesses, opportunities and threats (SWOT), productivity and performance indicators by company size, including workforce KPIs like:
- Revenue per employee
- Wages as a share of revenue
- Average wage
This allows credit teams to compare similar-sized businesses accurately and spot labor inefficiencies or operational strengths that national averages could miss.
No longer do teams need to rely on stats based on Fortune 1000 firms when assessing a regional borrower. Size-specific data gives smaller businesses a fighting chance to secure funding, and opens up entire revenue streams for lenders focused on the middle market.
Jamie’s portfolio
Jamie sees this firsthand in Northline Credit’s portfolio.
Take Single Location Full-Service Restaurants again. When Jamie drills into the Segment Benchmarking report for US firms with 5-9 employees, the picture shifts. While independents in this bracket are driving growth and gaining share, they also carry structural weaknesses that national averages can mask.
Key performance signals include:
- Faster revenue growth: The 5-9 employee segment has grown at 15.1% annually over the past five years, outpacing the broader industry’s 9.7% growth.
- Workforce expansion despite industry concentration: Employment in this segment has risen by 3% annually, while overall industry employment has slipped by 0.1%, showing independents are driving headcount growth.
- Efficiency gains, but still a gap: Revenue per employee has increased at a faster pace than the industry average, though absolute levels remain far lower, signaling that productivity gaps persist.
- Leaner cost structures: Wages account for 25% of revenue in this segment compared to 30.2% industry-wide, making these operators slightly less exposed to wage pressure.
- Stronger returns on wage spend: Revenue per dollar of wages has reached $3.99 compared with $3.40 industry-wide, showing these firms are extracting more value from each wage dollar.
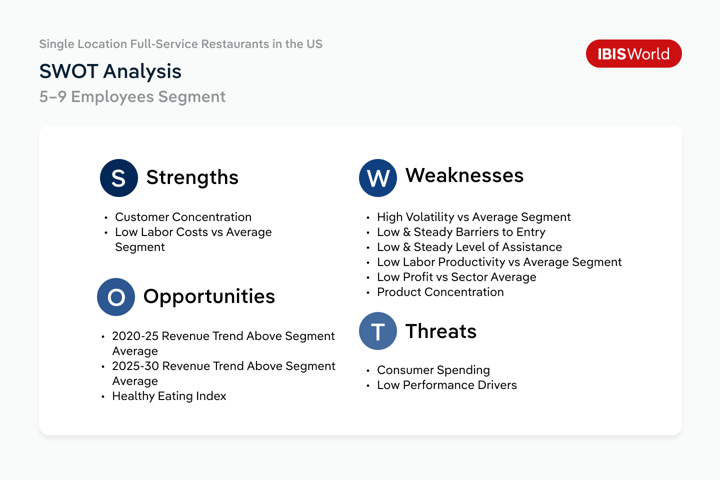
Segment SWOT analysis reinforces this picture: while smaller restaurants are benefiting from above-average revenue trends and consumer shifts toward healthy eating, they also face high volatility, lower labor productivity and thinner margins.
The 5-9 employee bracket is also likely to be where many women and diverse business owners are concentrated, making targeted insights essential for lenders looking to support underrepresented entrepreneurs while pursuing social impact and growth mandates.
State-level insights can refine the picture even further. New York, for example, accounts for 7.6% of all single-location full-service restaurant establishments in the US, with over 12,900 locations and 172,550 employees. Employment in the state has edged down slightly (-0.2% annually over the past five years), but total wages have continued to rise at 6.1% annually to US$6.9 billion.
The average wage of US$39,770 is nearly 36% higher than the national industry average of US$29,292. In a high-cost market like New York, a borrower with elevated wage bills may still be operating in line with local conditions rather than showing signs of overextension.
By combining national, segment and regional views (plus an understanding of each segment’s structural strengths and weaknesses), Jamie can set realistic expectations for borrowers of all sizes and avoid penalizing viable businesses for not matching the scale or cost structures of national chains.
How early benchmarking accelerated loan approval
A senior business advisor and current client at one of British Columbia’s largest credit unions shared a real success story with IBISWorld.
He was working with a newer start-up, which typically struggles to secure credit due to limited collateral and credit history. Using IBISWorld’s Key Statistics data, he worked collaboratively with the borrower to demonstrate strong operational performance, specifically benchmarking the customer’s “Revenue per Dollar of Wages” metric.
It turned out the client was generating more than double the industry average, effectively making money hand over fist compared to their staffing footprint. He used this data to pre-screen the borrower and present the case to the credit team. The result was a loan approval that would have otherwise taken weeks was turned around almost instantly.
But the value doesn’t end with approvals. On the flip side, credit teams also use these workforce benchmarks to spot signs of overextension. When a borrower’s wage expenditure significantly exceeds peers of similar size, it can quietly erode margins and increase the risk of default.
By comparing point-in-time performance alongside historical and forecasted labor trends, lenders can uncover these risks early, helping to avoid costly charge-offs and maintain a stronger portfolio position.
How other lenders are scaling this approach
This firm isn’t alone in their approach. One of the top five largest banks in the US specifically subscribed to IBISWorld’s Segment Benchmarking data to support more accurate analysis for their portfolio management strategy across different business sizes.
A senior executive in their credit risk group led the charge, using the data to guide everything from how they price loans, to which industries they focus their business development efforts on, and where they tread more cautiously.
Before IBISWorld, the team struggled to find reliable, up-to-date information about the businesses they worked with. Government sites were often incomplete or difficult to navigate across markets. This made the bank more cautious and resulted in missed opportunities—opportunities their competitors were quick to seize.
With our Segment Benchmarking, they gained the confidence to scale faster, act smarter and meet core strategic mandates.
From borrower performance to broader trends
Back at Northline, Jamie uses this same data to make grounded, defensible credit calls, particularly for borrowers where labor costs, wage structure or staffing productivity are central to creditworthiness. But to assess whether those pressures are borrower-specific or reflective of broader market dynamics, they turn to IBISWorld’s Key External Drivers next.
Step three: Validate borrower risk with macro and regional drivers
To understand whether labor pressures in borrower data are isolated or systemic, Jamie uses our Key External Drivers. These indicators track macro trends, such as unemployment rates, labor force size, wage growth, hours worked and productivity levels, across major markets including Australia, the UK, the US and Germany. Demographic shifts are particularly important. According to ABA economist JP Rothenberg, noting that in the forecasting space, demographics are “one of the only reliable long-term projections at our disposal.” For Jamie, this makes them an essential lens for assessing structural risk.
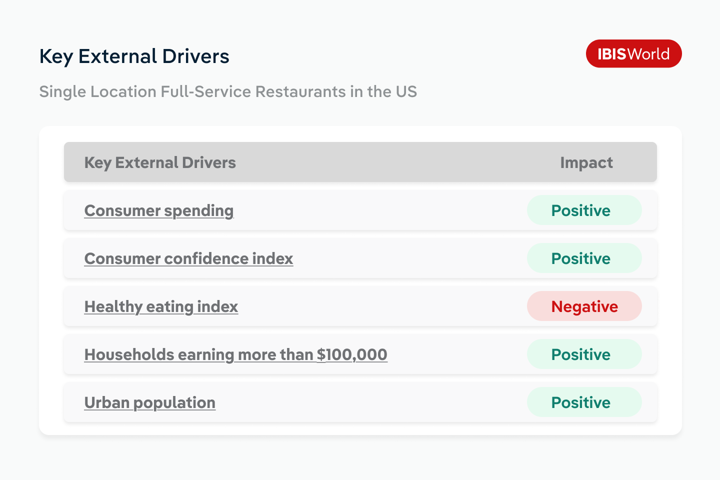
When assessing the Single Location Full-Service Restaurants industry, these macro indicators are complemented by industry-specific drivers such as consumer spending, consumer confidence, the healthy eating index, household incomes above US$100,000, and urban population growth.
If wages are forecast to rise in a low-margin industry, Jamie knows to weigh those pressures against shifts in demand drivers. For example, whether consumer spending and confidence are strengthening, or whether a trend like healthier eating habits could dampen growth. This helps determine whether wage growth is manageable within a supportive demand outlook, or whether it could tip borrowers into financial strain.
Regional reports as a decision-making tool
For localized insights, Jamie uses IBISWorld’s State and Provincial Economic Profiles, which track demographic trends like unemployment rate, population and job growth, education level and per capita disposable income. These offer standardized insights across all 50 US states, ten Canadian provinces and three territories, and allows the team to spot geographic pockets of rising labor risk (or untapped industry potential) before competitors do.
In regions where these profiles aren’t available, such as Australia, Jamie can turn to our Enterprise Reports to offer another layer of granularity. These reports cover the country’s largest companies, organizations and government departments, and include employee figures and financials.
Jamie uses these reports when assessing high-value enterprise borrowers, especially in labor-intensive sectors. The data helps validate staffing decisions, identify cost blowouts and prepare more informed recommendations for Northline’s senior risk team.
From macro to micro: Why reliable regional insight matters
It can be challenging to have a comprehensive, up-to-date and standardized source for all of this information, and financial institutions can’t make strategic business decisions based on unverified data, hallucinations from AI, or “slush” from free sources or Google.
From my work with banks and credit unions, I’ve seen the difference it makes when teams have access to clean, reliable regional insights. Many of the banks I work with leverage IBISWorld’s ability to sort all industries within these markets by fastest expanding industries by employment growth rate, available with historical analysis dating back to the past five years across the thousands of industries IBISWorld covers at the state and provincial level.
Rather than directing costly resources toward industries based solely on what other banks are doing, rumblings at local Chambers of Commerce, or biased publications, this empowers growth-focused banks to prospect customers based on raw data across all industries in the economy, and uncover needle-in-a-haystack opportunities to achieve lofty revenue and growth goals.
By layering together industry-wide signals, regional workforce trends and peer-to-peer benchmarks, credit teams can build a more complete picture of labor-related risk and identify the moments that matter before credit pressures escalate.
Final Word
As we always say, no industry operates in isolation. External pressures in the labor market can leave borrowers (and banks in turn) susceptible to underlying industry risks.
According to the World Economic Forum’s 2025 Future of Jobs report, several forces are reshaping the workforce landscape: from the rise of AI and automation, to an overall global slowdown, ageing populations in developed economies and geopolitical tensions shifting supply chains.
These signals align with the insights in our latest white paper series, which explores workforce pressures and credit implications across Australia, the United Kingdom, the United States and Germany. Together, these resources offer a clearer view of how labor risk is evolving and what it means for long-term portfolio strategy.
Using IBISWorld’s deep domestic and international research to understand these shifts isn’t just a nice-to-have, it’s a crucial imperative. Surfacing labor risks and opportunities earlier allows banks to better understand their portfolio, uncover hidden downsides, spot growth potential and identify industries that may require more attention before delinquencies or charge-offs occur.
These incidents are inevitable, but minimizing them through credible, standardized insights leads to stronger balance sheets, healthier earnings and better outcomes for teams and customers alike.